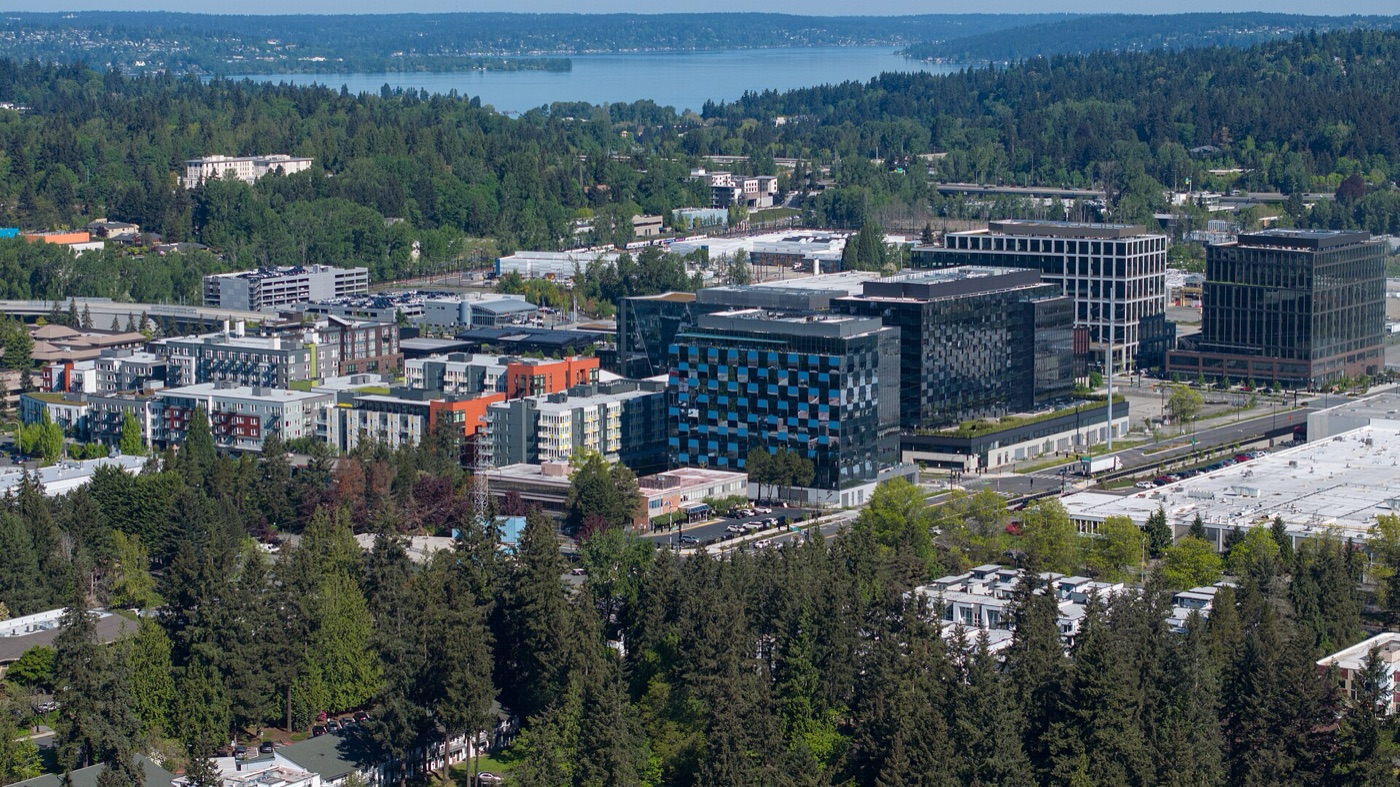
Both rates use the same 2023 population base. Many of Redmond's new buildings came from national apartment companies, in a city with more jobs than homes, and Redmond has since zoned its station areas for far more.
The yearly swings are large; Redmond's longer run leads
━ Redmond · ┄ Bellevue, three-year average
New apartments per 1,000 residents, per year
Single years swing widely. Lines show trailing three-year averages, first shown in 1992. Each year uses its own Washington OFM April 1 population (census counts in census years), rather than today's population. Assessor year built dates the entire complex; this is not a count of annual permits. Parcel cities follow the assessor snapshot; population follows each year's boundaries, so annexations can affect older rates. 2024 onward is omitted because of recording lag. Sources: King County Assessor; Washington OFM↗.
The two designated centres took 87% of the apartments
87% of Redmond's new apartments went up in two places, downtown and Overlake
Downtown
Downtown Urban Center
3,097
Overlake
Overlake Metro Center
2,897
Rest of Redmond
outside the two designated centres
916
Apartments in Redmond's 31 complexes built 2015 to 2023, 6,910 units, placed by parcel area centroid inside the city's official Downtown Urban Center and Overlake Metro Center boundaries, or elsewhere in Redmond. Current boundaries, read 27 October 2026, applied to 2015–23 buildings. Sources: City of Redmond GIS and King County Assessor/GIS.
Overlake's biggest projects replaced large, single-owner sites on the Bellevue line. Downtown's growth spread across eighteen complexes, along Bear Creek Parkway, Redmond Way and the streets around Redmond Town Center. The rest of Redmond added 916 apartments, nearly half in one 450-unit complex next to what is now Marymoor Village station. Downtown and Overlake here mean the city's designated Downtown Urban Center and Overlake Metro Center. The map shows those same boundaries. The comparison with Bellevue is citywide.
Who builds, and with whose money
Market-rate investors built much of the new housing; employer-backed loans also preserve existing apartments and finance a newer affordable pipeline.
Player
What it did
Where
Amount
Year
AvalonBay
Built and held Avalon and AVA Esterra Park: 805 apartments
Esterra Park, Overlake
482 + 323 homes; cost not stated
2015–23
Capstone Partners / Lionstone
Bought former Group Health campus to build Esterra Park
Overlake
$32.5M land purchase
2013
Merlone Geier Partners
Bought Overlake East shopping centre; secured master plan
Overlake
$41M land purchase
Bought 2019; plan 2024
Lakevision Capital
Bought Parkside's 664 homes from Lincoln/Daiwa; resale, no new units
Esterra Park, Overlake
$286M sale
Sold 2024; built 2021
Microsoft / KCHA¹
Preserved 1,029 homes in five complexes; first major use of $500M regional pledge
Bellevue, Kirkland, Federal Way; no Redmond
$60M below-market loan
2019
Amazon fund / KCHA¹
Acquired seven properties; preserved 1,084 homes
Mostly Bellevue; also Federal Way
$185.5M loans/grants; not total price
2021
Amazon / Bellwether Housing
Financing Prisma: 328 affordable homes opposite Overlake Village station
Overlake, Redmond
Amazon amount not disclosed
2026 start; 2028 planned
Amazon / City of Bellevue
Affordable housing, especially city-supported or city-owned transit sites
Bellevue
$100M commitment; spending not reported
Feb 2025
¹ KCHA: King County Housing Authority. Amazon's newer projects do not explain the earlier 2015–23 production gap.
Three things line up, and none of them is measured here as a cause.
Overlake's land came in big pieces. A 28-acre hospital campus and a strip mall, each sold to one buyer, can be planned as a neighbourhood at once.
Redmond has more jobs than homes. Microsoft's headquarters is there. In 2017 only about 31% of Redmond residents also worked in Redmond, down from 38% in 2010, and nine in ten people who work in Redmond lived elsewhere. A new apartment near those jobs fills.
The rules differ, in both directions. Redmond charges no school impact fee on a new apartment and puts the whole fee on new houses ($5,972 each in 2025). Since January 2025 it requires no parking at all for apartments near frequent transit; Bellevue's code still sets a minimum (half a space per apartment downtown, one elsewhere), though since 2025 state law has barred any minimum within half a mile of a light rail station. But Redmond also asks more: in nearly every neighbourhood, new apartment buildings must include affordable units, 554 of them by 2021. Bellevue required the same citywide from 1991 to 1996, then made it voluntary, and two projects have used it since. Redmond builds more while asking more. The parking change postdates the building above, so it bears on what comes next, not on what came before.
Is it working
Rents point the right way, and the data is thin. Listing sites put Redmond's average rent about $200 a month below Bellevue's in 2026, with vacancy at 3.8% against 4.7%; we found no city-by-city rent series for the years in between. The strain shows in schools: the Lake Washington School District, which covers Redmond, went from the state's sixth-largest district to its second in five years to 2019, and is adding about 4,600 permanent seats by 2030.
What comes next
The next test is whether the station-area projects become occupied homes. The August 2026 assessor snapshot records 3,183 apartments with 2024–25 years built in Redmond, against 876 in Bellevue; those are recorded additions, not a count of homes currently under construction. The live pipeline below is separate.
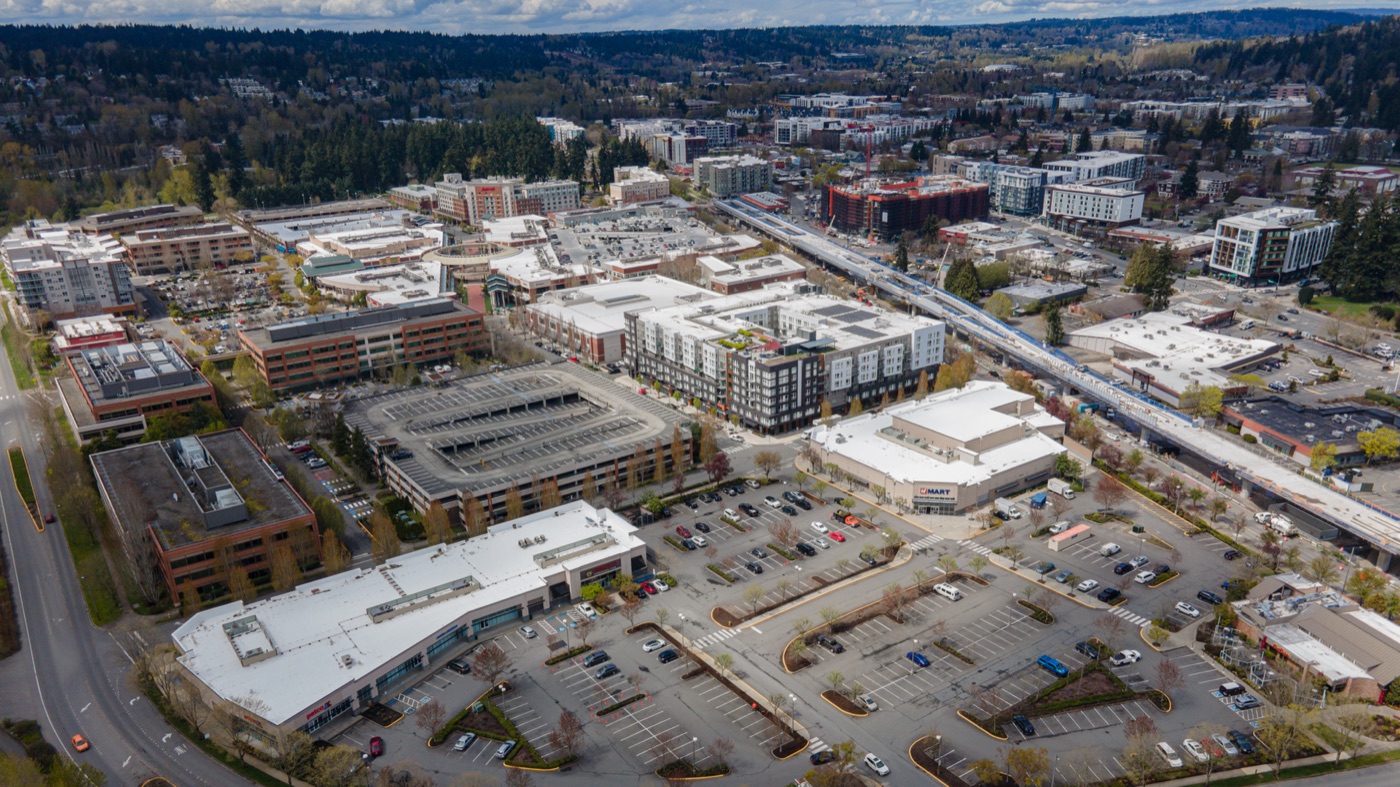
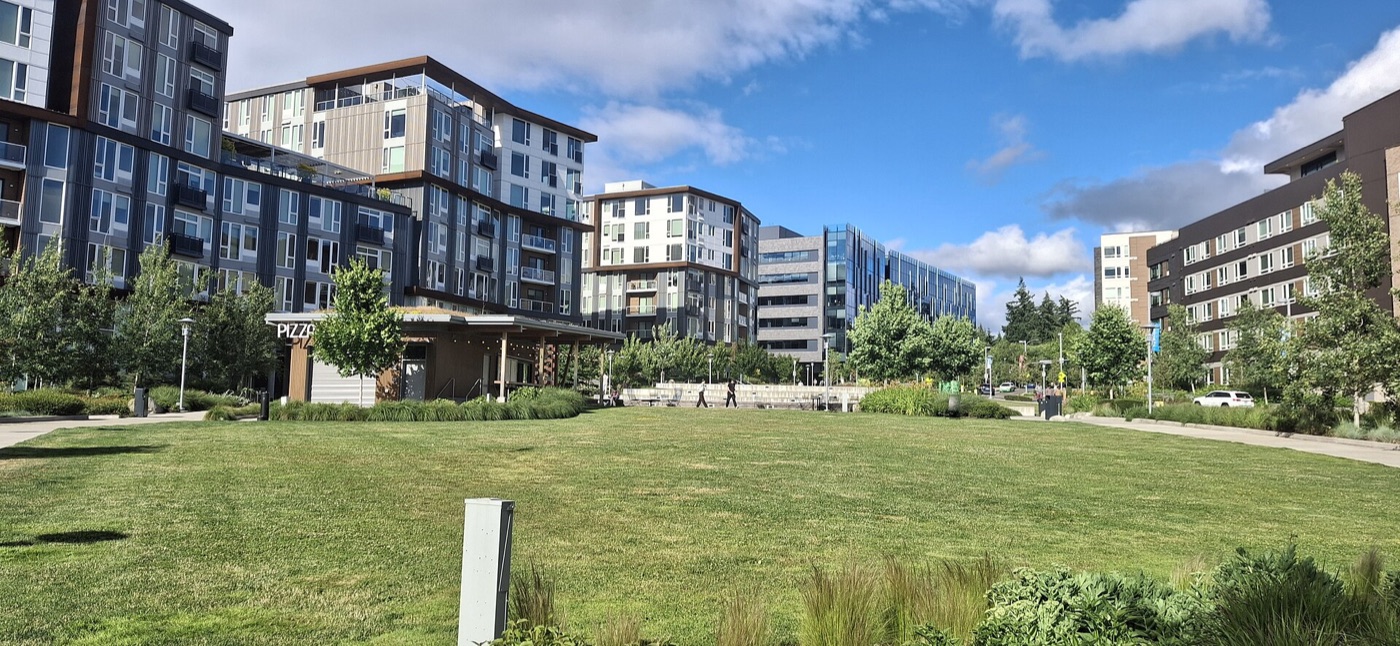
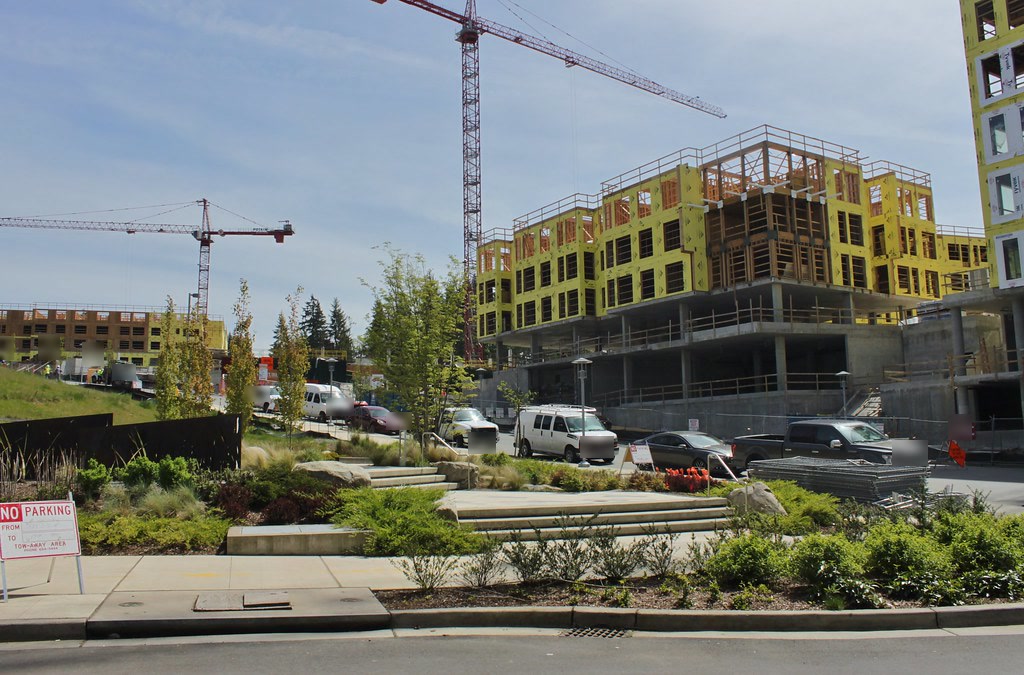
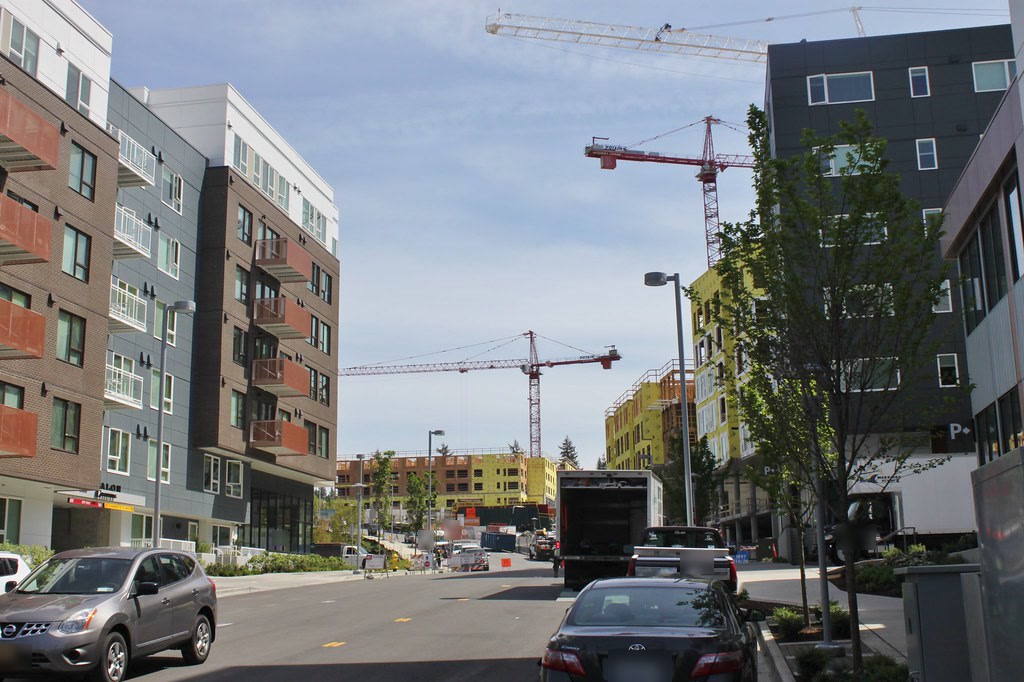
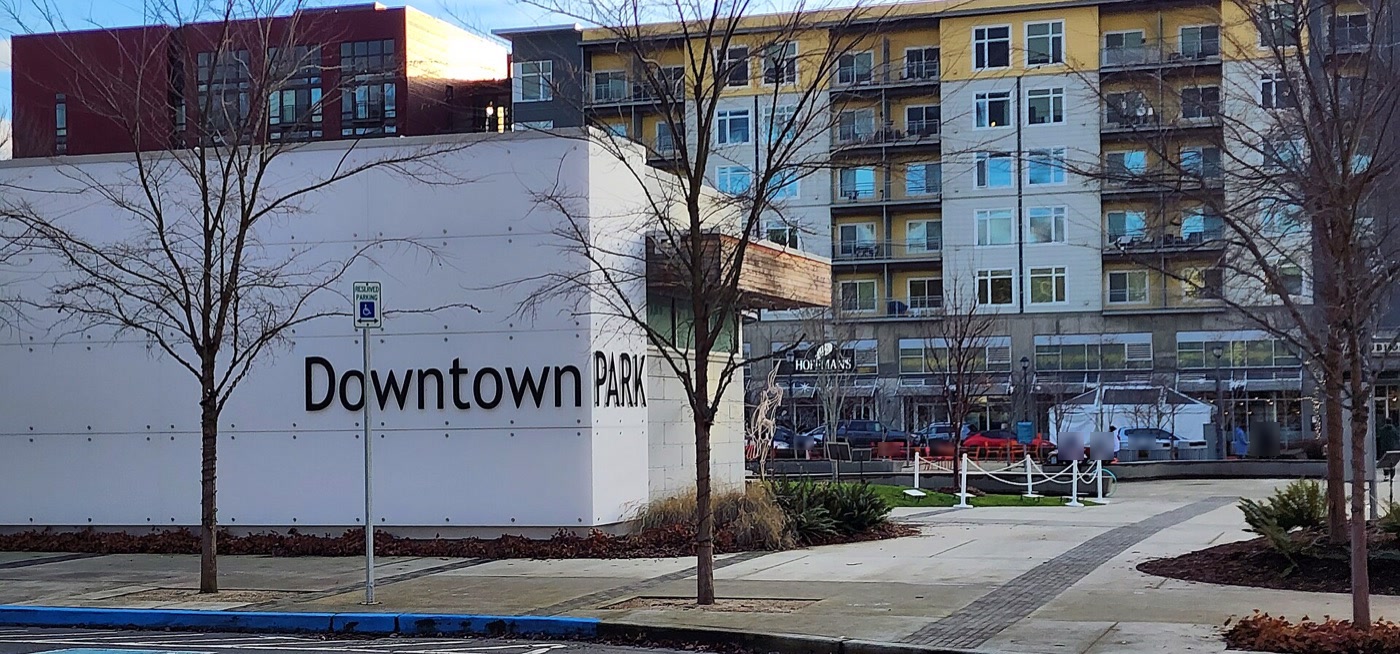
Apartments at Esterra Park, June 2026. This neighbourhood replaced the former Group Health campus.Esterra Park taking shape at Calder Avenue and Turing Street, May 2018. This is the earlier building boom, not the construction sites described below.Completed homes and more buildings rising along Turing Street, Esterra Park, May 2018.Mid-rise homes face Downtown Park on Redmond Way, January 2023, more than two years before the downtown station opened.
1 / 4
What to watch
Homes and stage
Next date
Prisma, across from Overlake Village station
328 affordable apartments; Bellwether has broken ground
Planned opening in 2028
Cascade View East, 16310 NE 80th Street
270 apartments; city entitlement and the project's leasing brochure identify the scheme as under construction
Brochure markets delivery in 2027; no exact opening day
Redmond's 2027–28 budget
Next hearing on the city's spending plan, including housing and the infrastructure serving growth
Monday 2 November 2026, 7 p.m., City Hall; adoption scheduled for 10 November
Rail is already in place: Overlake opened on 27 April 2024, Downtown Redmond and Marymoor Village on 10 May 2025, and trains began crossing Lake Washington on 28 March 2026↗. Redmond's 2050 plan, effective January 2025, permits up to 30 storeys in Overlake and 12 downtown and at Marymoor Village. Watch the 2 November budget hearing, then the advertised 2027 and 2028 apartment deliveries along that line.
How this was checked
Checks against this finding
Is Redmond just smaller? Dividing by population corrects for size, and Redmond builds more apartments outright as well.
Is each building in the right city? Each takes the city on its parcel record. ZIP codes cross city lines, and the first version of this page used them.
Does it matter which record dates a building? Not over 2015–23: the assessor's year built gives 2.9 times, the final inspection 3.2 times. Over 2020–23 alone the ratio swings from 2.4 to 8.8, which is why the headline uses nine years.
How were the three areas drawn? By parcel area centroid inside the city's official Downtown Urban Center or Overlake Metro Center, with all other Redmond parcels counted as the rest of Redmond. These are the current designated boundaries retrieved on 27 October 2026, applied to buildings dated 2015–23; they do not reconstruct the zoning at construction.
Why are other cities missing? Issaquah, Sammamish and Mercer Island read zero for every year from 2020 to 2023, which looks like a gap in the records, so they are left out.
The chart counts apartments by each complex's year built, 1990–2023, divided by that year's Washington OFM April 1 population. Lines average the current and previous two annual rates. Assessor parcel jurisdiction is held at the snapshot date; historical populations follow each year's city limits, so annexations affect older comparisons. The 2015–23 headline keeps its stated ACS 2023 population base: the apartment counts are unchanged. Annual OFM denominators also support the broad threefold finding.
What is not claimed
That any one of the three reasons caused the gap. They line up with it; this page measures where and how much, not why.
All housing. The assessor's apartment file excludes condominiums and small multifamily.
How much any city should build. This is production, not need.
Sources (19)
Sources
King County Assessor apartment and parcel extracts, retrieved 2026-08-24 and joined on parcel number (all 9,151 complexes matched).
Parcel area centroids from King County GIS polygons, calculated in Washington North State Plane coordinates (EPSG:2926), retrieved 27 October 2026.
Headline population: American Community Survey 2023 5-year estimates. Annual chart population: Washington OFM April 1 city estimates, 1990 onward↗, read 27 October 2026; census counts in decennial years. Pinned in distribution/data/ofm-april1-population.json.
Official centre boundaries: City of Redmond GIS Center layer↗, credited PSRC and CORGIS, retrieved 27 October 2026: Downtown Urban Center (Urban) and Overlake Metro Center (Metro). Exact polygons are used for the count; the map clips them to city land, excluding Lake Sammamish and Lake Washington. Bellevue retains its citywide boundary. City limits and lakes are from King County GIS. All 31 parcel assignments were checked.
Redmond building permits 2010–2026, from the City of Redmond's public records staff by request W038685-082526, received 2026-09-04. Anyone can ask for the same export.
Bellevue's building permits from the MyBuildingPermit portal, collected 2026-08-29.
DJC, for the reasons.
425 Business, for the reasons.
JLL, for the reasons.
The Urbanist, for the reasons.
GeekWire, for the reasons.
RentCafe, for the reasons.
Point2, for the reasons.
Redmond's 2025 impact-fee schedule, for the reasons.
Redmond Zoning Code 21.20, for the reasons.
Redmond 2050 (Ordinance 3181), for the reasons.
Bellevue's 2016 Affordable Housing Strategy, for the reasons.
Esterra Park taking shape at Calder Avenue and Turing Street, May 2018: SounderBruce, 2018, CC BY-SA 2.0, via Flickr, modified.
Completed homes and more buildings rising along Turing Street: SounderBruce, 2018, CC BY-SA 2.0, via Flickr, modified.
Mid-rise homes face Downtown Park on Redmond Way: HominyGrits007, 2023, CC BY-SA 4.0, via Wikimedia Commons, modified.
Updates and corrections.
Updated 27 Oct 2026. The chart now shows annual production with each year's OFM population and a three-year average. Added Amazon's affordable-housing financing and dated project deliveries. The 2015–23 headline and apartment counts are unchanged. The nine-year window, adopted on 26 September after comparing assessor dates with final inspections, remains the headline's basis.
This page takes in an earlier one, “The corpus could not be counted. Now it can, and the labels were the real problem”, which was corrected. What changed→
New stories from Bellevue, in your inbox
One email when a new story is published, with any corrections. Nothing else.