Community
Fewer people are reporting homelessness to Bellevue this year. Police mental-health calls are heading for a record.
3 min read
Most overdoses are survived; about two dozen a year are not. Who died, which drugs, how Seattle compares, and where to get help.

The figures on this page come from Public Health – Seattle & King County. An epidemiologist there made the Bellevue counts for this page on request. Its overdose dashboards carry the counts for 2026 so far.
Annual overdose deaths in the county’s Bellevue series
Bellevue recorded between 14 and 32 overdose deaths a year from 2019 to 2025. The highest year was 2023 and the lowest 2024; 2025's 27 was in line with the years before. At these sizes a few deaths swing the percentage a lot, so seven years of counts do not show a trend, and they cannot say whether any program changed one.
Each death is counted where the overdose happened, not where the person lived. That makes these deaths in Bellevue rather than deaths of Bellevue residents. The county made this table once and will not update it; counts for 2026 so far are on its dashboards.
Bellevue sits in the county's East region, with Kirkland, Redmond, Issaquah, Sammamish and the rural land east of them. Seattle is its own region.

Seattle East region Other county regions Bellevue HRAs (within East)
The box locates the Seattle–Bellevue area enlarged above. The East reporting region continues well beyond Bellevue, toward the Cascade foothills. Seattle and East are separate regions.
In 2025 478 people died of an overdose in Seattle and 65 in the East region. Seattle also has more people, so the fair comparison is the county's age-adjusted rate:
Seattle53.1
East region9.7
That is 53.1 deaths per 100,000 people in Seattle against 9.7 in the East. The county does not publish a Bellevue rate, and we do not work one out from the city's counts. The rates say how far apart the two regions are, not why.
Most overdoses are survived. In 2025 paramedics in the East region treated 397 suspected opioid overdoses, and emergency rooms saw 196 visits from East residents for one. The same year, 65 people in the region died of an overdose of any drug.
Both counts rose to a peak in 2023 and have since fallen back to where they were in 2019. Seattle's have not: paramedics there treated 3,582 in 2025, three times the 1,138 of 2019.
Seattle East region
So far in 2026: through 1 November, paramedics in the East region had treated 297 suspected opioid overdoses, against 330 by the same date in 2025. The county updates these counts weekly on its overdose dashboards.
The county publishes these for the region, not for Bellevue. They count treatments, not people: someone treated twice counts twice, and a suspected overdose is not a confirmed one. Bellevue's police drug-law calls, a different measure, have been flat since 2021.
54 / 65
were recorded as living in
privately owned or rented housing
Private housing Other or unknown
The Medical Examiner's investigators record where each person was living. In 2025 they recorded 54 of the East region's 65, about 83%, as living in private housing: homes owned or rented privately, with no known tie to a government or social service program. That is where people lived, not necessarily where they overdosed. Most of the people who died had a home.
Of King County's 2025 overdose deaths, 772 were people aged 25 to 64, more than four in five, and the largest group was 35 to 44. Thirty-five were 18 to 24. The county publishes no exact count for children and teenagers, because each of those groups had fewer than ten deaths. It does not break ages down by region, so there is no East region or Bellevue figure.
Across King County in 2025, fentanyl was involved in 708 overdose deaths, 77% of the total. Methamphetamine, cocaine and prescription opioids are tracked too, and one death can involve several drugs. The Bellevue table has no breakdown by drug, so this is the county figure.
The city funds three things that reach overdoses:
None of these figures measures whether Bellevue's overdose deaths have changed.
Public Health runs the countywide response: treatment access, naloxone and other prevention supplies, and training. Its overdose prevention page posts current overdose-risk alerts.
The county's Get help page links to treatment, prevention supplies, family support and grief support. Public Health suggests these steps for anyone:
The figures come from Public Health – Seattle & King County, which supplied the Bellevue series and publishes the overdose dashboards. Its Medical Examiner's Office is the underlying source for the deaths.
An overdose death involves fatal acute drug poisoning or intoxication. The county's Medical Examiner surveillance includes suspected and confirmed cases. A suspected overdose death is a death whose cause is still being confirmed. Finding a drug in a person's body is different from determining that it contributed to the death.
The Medical Examiner's investigation uses scene information, a physician's examination and, as needed, an autopsy and toxicology. Police may contribute evidence; medical certification belongs to the Medical Examiner. A death outdoors can count, as can one in a home or hospital. Location alone does not determine the cause.
Early suspicions can be confirmed or ruled out, and classifications can change as results arrive. We have no measured estimate of undercounting in the current Bellevue table. The county restricts detailed reports but publishes cause and manner of death; privacy suppression of small groups is separate from classifying the medical cause.
An overdose death count describes lives lost. Understanding drug use across a community also requires information about people who survive an overdose and people who use drugs without one.
| Question | Evidence needed | Bellevue coverage here |
|---|---|---|
| How common is drug use? | Representative surveys | No citywide estimate established |
| How many overdoses are survived? | EMS and hospital records, with survival status | County EMS and emergency-room counts of suspected opioid overdoses by region, 2019–2025; no Bellevue series |
| How many people died? | Death investigations and certificates | County-supplied Bellevue totals, 2019–2025 |
| What do residents encounter in public? | Place-specific observations and reports | Not measured by the death counts |
Alcohol and cannabis also have harms that this death series cannot assess on its own. For example, alcohol-related disease and cannabis-related driving impairment require other measures. A small contribution to an overdose table is not a measure of overall safety.
The county's EMS data counts possible or probable opioid-overdose incidents treated by responders, scored from what the run report records: an overdose impression, slowed breathing, naloxone given, pinpoint pupils and similar signs. Checked against charts, about four in five flagged incidents were real opioid overdoses, and the score caught about four in five of those. An incident count is different from a count of individual people, and the EMS records include neither all drug use nor every overdose. The emergency-room counts are visits by residents of each region and are preliminary: recent months fill in as hospitals send records. The county explains the coverage in its EMS methods report.
Public Health supplied a workbook on 2 November 2026 with annual counts for 2019–2025. Its footnote names the King County Medical Examiner's Office and says health reporting areas are combined for Bellevue, Kirkland and Redmond. Bellevue's row reads 16, 17, 24, 28, 32, 14 and 27. We checked the transcription against the workbook and retained the original file.
The series begins in 2019 because the original inquiry requested that window and the county supplied it. This gives a pre-pandemic reference; it is not the start of overdose surveillance or of the local problem. The regional dashboard extends to 2016. We use 2019–2025 here as a common window with the supplied city series; living-situation data start in 2019.
The workbook suppresses counts from 1 to 9 with a caret. Those cells are not zeros. The Bellevue series contains no suppressed cells. On 5 November Public Health confirmed that the workbook counts each death by where the overdose happened and uses the dashboard's case definition. It did not state an extraction date; the receipt date is not the extraction date.
The housing figure comes from the dashboard's 2025 regional housing export, downloaded on 2 November. We divide East-region private-housing deaths, 54, by that table's East-region total, 65. Presumed living situation is an investigator classification, not an incident address. We publish no small housing-category cells and reconstruct no suppressed values.
The 65-dot drawing uses one dot for each death in this regional table; 54 are marked as private housing. The remaining living-situation categories are grouped together. It is not a map, city-level breakdown or risk estimate.
The regional comparison uses the Medical Examiner Trends export, with Count and Region selected, downloaded on 2 November. It preserves seven annual observations for each region. Blank auxiliary rows are omitted; blank or suppressed values are never converted to zero. The 2025 endpoints match the separate regional map: Seattle 478 and East 65. The housing table's Seattle 479 is not substituted into either series.
The Trends view includes suspected overdoses pending toxicology, as its footnote states; these are the county's surveillance counts. The Rate/Region export was separately checked against the UI crosstab. Its unit is per 100,000 population, with regional rates age-adjusted. The uncertainty intervals appear beside the rate graphic. Occurrence-based counts and resident denominators need careful interpretation; these intervals do not describe every source of misclassification.
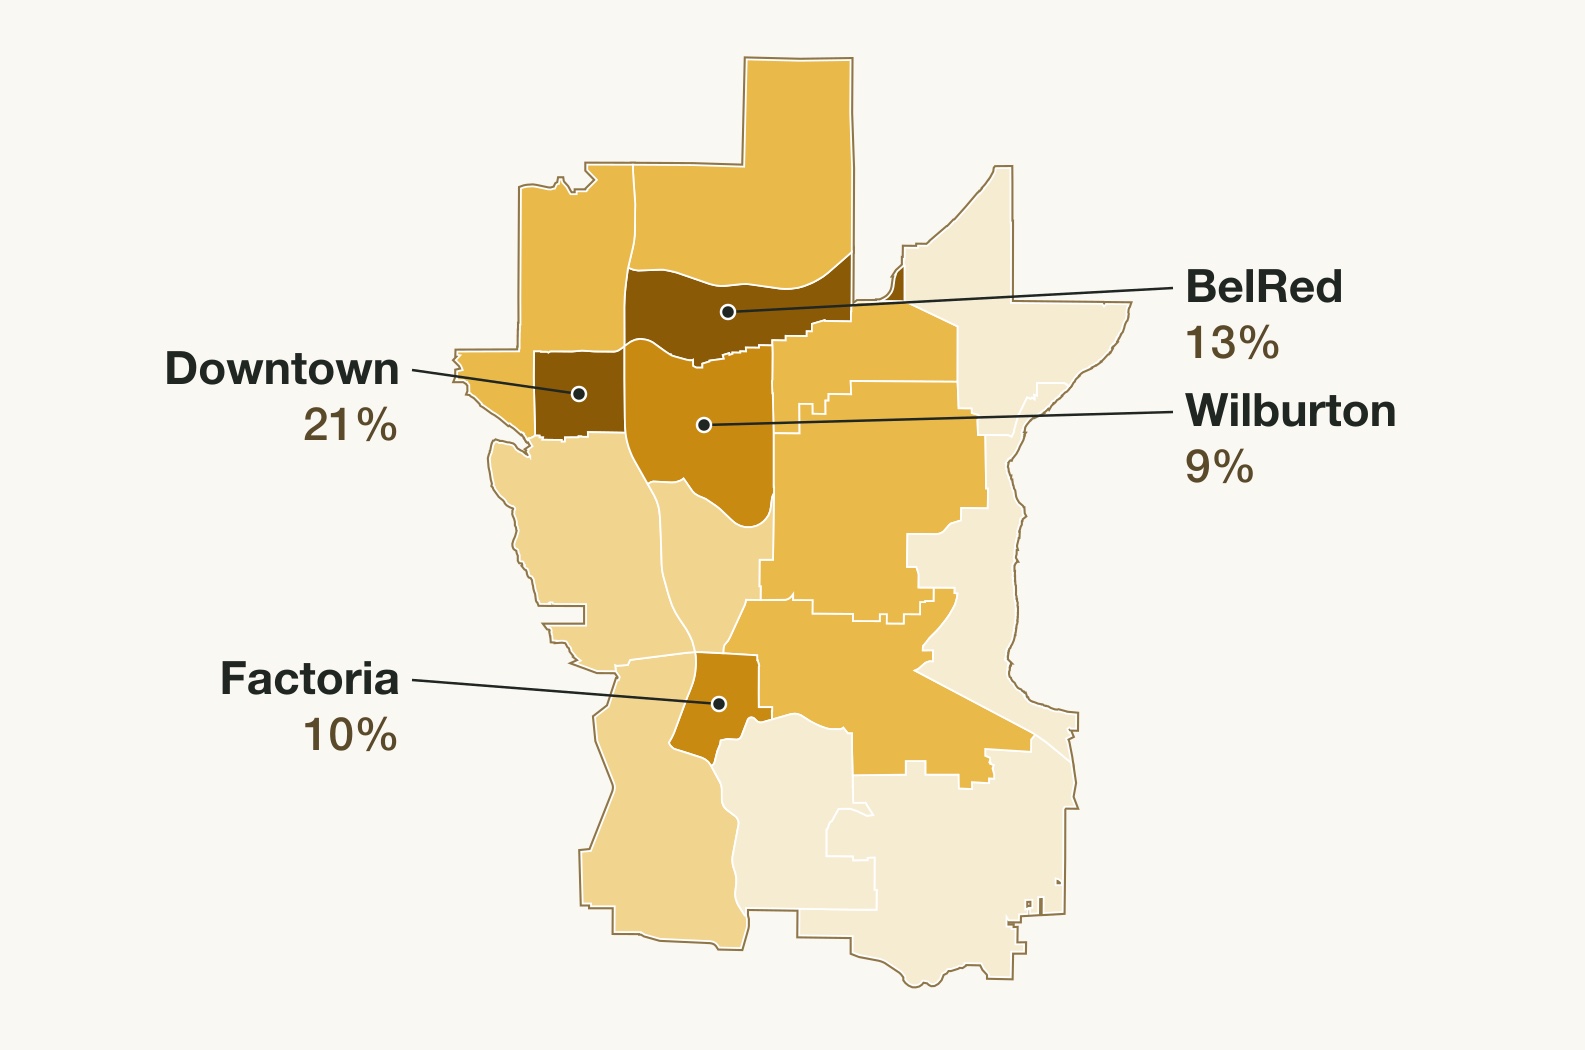
The map groups official health reporting area polygons by their recorded reg_nm field. Seattle and East are separate categories, with Bellevue's four HRAs in East. The map is a reporting-area illustration, not a map of individual deaths, population density or precise legal city borders.
The fentanyl count and share are the figures displayed in the dashboard's Drugs Involved tab for 2025, read on 2 November. Its county denominator is not substituted for another tab's total. The saved housing and regional map exports disagree by one Seattle death, and an earlier fatality-review total also differs. This page uses each source within its own scope.
The age counts are the 2025 King County rows of the dashboard's Demographics tab, read on 7 November. The tab counts age for the whole county only; selecting a region does not re-count the age rows. Its counts from 1 to 9 are suppressed, and we do not reconstruct them; the four-in-five share holds whatever those cells contain.
Counts are not population-adjusted rates. This page estimates no prevalence, assigns no geographic cause and attributes no change to a policy. The county help links were checked on 2 November; their operators maintain the service details.
The county's fatal-overdose methods report, updated November 2025, distinguishes Medical Examiner occurrence data from resident-based death certificate records. Public Health confirmed separately that the custom workbook uses overdose location. Its December 2025 EMS methods describe a separate incident definition. The city needs assessment is used for its local care priorities and reported access needs (pages 124–128), rather than its older countywide overdose summary.
Public Health asked that its data be credited to Public Health – Seattle & King County with a link back to its dashboards, as this page does. No staff naming, email quotation, endorsement or logo reuse is implied.
Updates and corrections. None so far.

One email when a new story is published, with any corrections. Nothing else.
Community
3 min read

Community
5 min read

Community
4 min read