An invented shelter room, drawn for this page. No real shelter or person is shown.
On the nights of late January 2024, 1,910 people were homeless in East King County, the cities from Kirkland and Redmond down through Bellevue to Issaquah and Mercer Island. 796 slept in a shelter. 1,114 slept outside, in tents, doorways and cars. The Eastside had 1,018 shelter beds that winter.
Across King County the count was 16,868. The next count, taken this January, found 18,365, up 9%, and for the first time nearly two in three of them outside. Its Eastside figure has not been published yet.
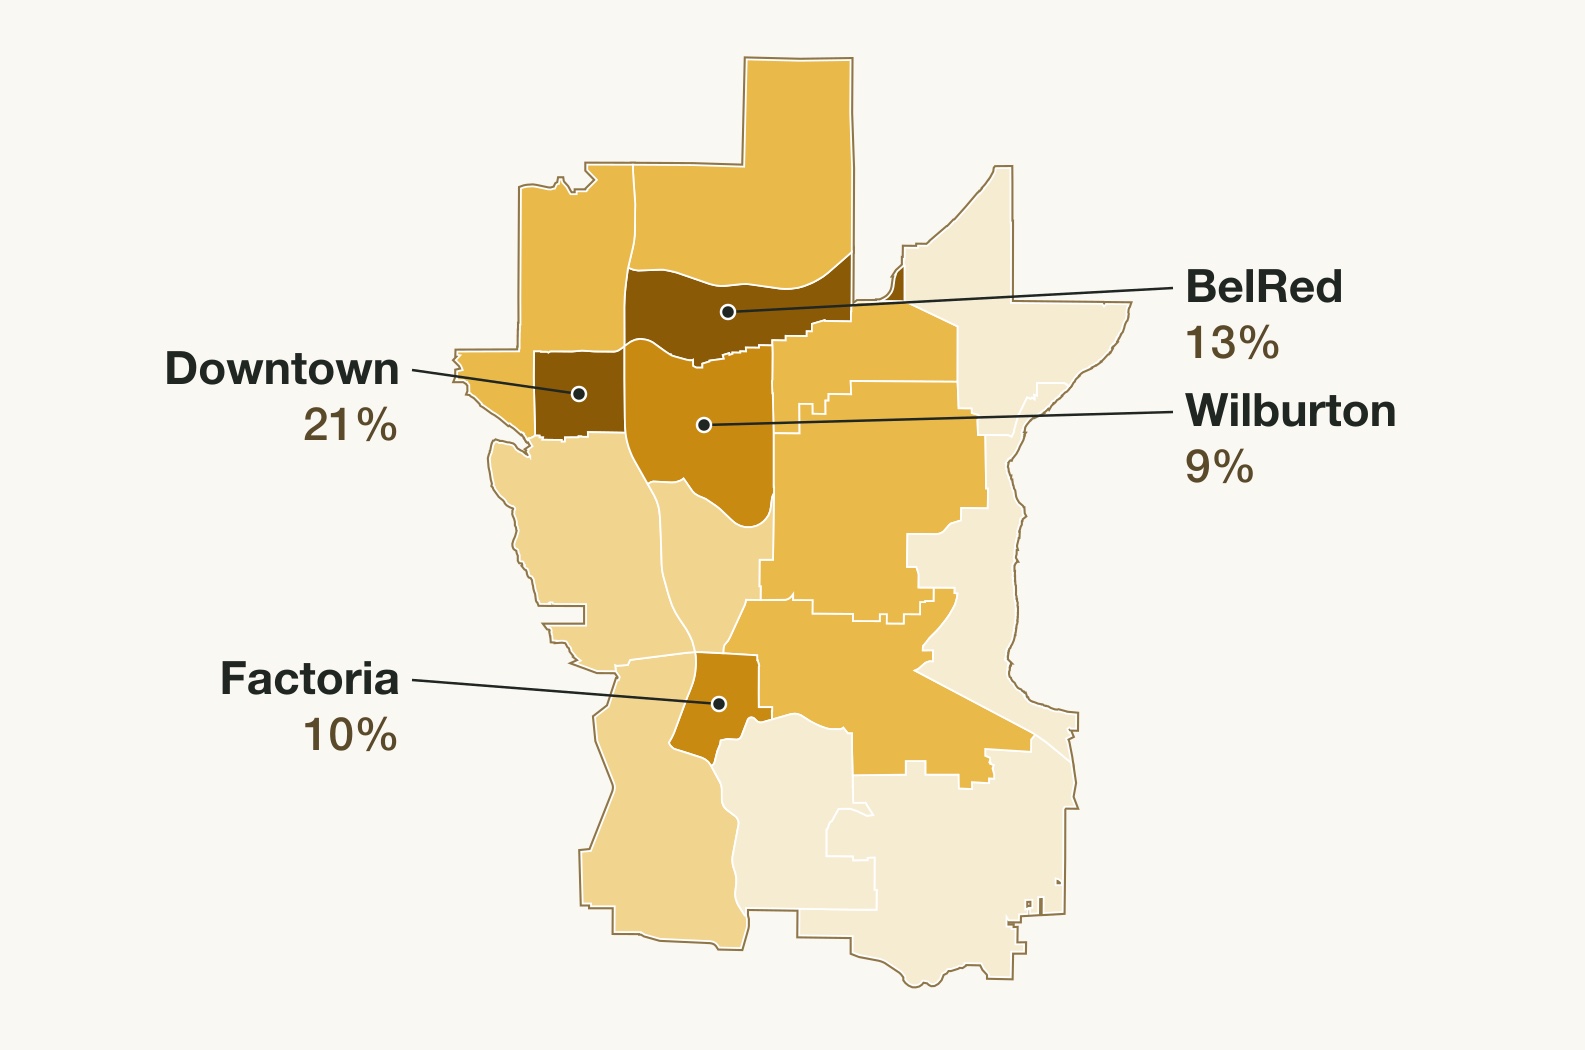
East King County, as the count draws it: 11 cities from Kirkland to Issaquah
East King County: 11 citiesCounted in North King CountyNot named in the reportUnincorporated land
The count's East King County since September 2024: Beaux Arts Village, Bellevue, Clyde Hill, Hunts Point, Issaquah, Kirkland, Medina, Mercer Island, Redmond, Sammamish and Yarrow Point (Beaux Arts, Hunts Point and Yarrow Point are too small to label). Bothell, Kenmore and Woodinville are counted in North King County. The report does not name Newcastle, or say where unincorporated land such as Bridle Trails is counted. Issaquah and Sammamish joined in 2018, so earlier Eastside figures cover less ground. Source: KCRHA 2024 Point-in-Time Count, East King County profile. City limits and lakes: King County GIS.East King County on the night of 25 January 2024. 1,018 shelter beds in the inventory, 796 people in them, 1,114 people outside. The 222 unfilled beds are 78% occupancy against 89% countywide, and they are not spare capacity: beds carry restrictions a person outside may not meet, and KCRHA's own report names a gap in services for couples. The unsheltered figure is a respondent-driven sampling estimate published without a confidence interval. Source: KCRHA 2024 Point-in-Time Count, revised edition, Table 3 and Figure 69.
Who is counted
Most are men (82%), and they are older than people assume: about half are over 45, and East King County has the second-largest share over 65 of the county's seven areas. Six in ten of those outside had been homeless for a year or more, or repeatedly, with a disabling condition.
Asked where they last had a stable home, 19% said Seattle, 17% Bellevue and 19% another state.
The count's own report sums up the Eastside's services: 18 providers and more than 60 programs, and "a notable gap in services available for couples."
Where people sleep
Who
Where
What there is
Men
Eastgate, Bellevue, run by PorchLight
100 beds since summer 2023, and 92 supportive studios next door
Women
The Sophia Way, Bellevue
More than 100 women a day, from eight mats in 2008
Families
Mary's Place, downtown Bellevue
Closed in 2026; no replacement announced
People in cars
A safe-parking lot on city land near downtown Bellevue
Up to 20 vehicles since 2024, families with children first
Eastgate opened after fifteen years in temporary sites. PorchLight was named Congregations for the Homeless until 2023, and the studios next door, from Plymouth Housing, were the Eastside's first permanent supportive housing. The Sophia Way began in Bellevue First Congregational Church.
Mary's Place's family shelter was a former hotel on NE 12th Street. In Mary's Place's words: "Our Bellevue shelter closed when the building's owner needed it back for their own project, and we could not find a replacement." Countywide, shelter beds fell by 689 between the 2025 and 2026 counts, in large part family beds.
Countywide, 27% of people living outside in 2024 lived in a vehicle; the report does not break that out for the Eastside.
How the number is made
Until 2021, volunteers walked the county on one night in late January and counted the people they saw. The regional homelessness authority (KCRHA) dropped that method because it undercounted.
Since 2022 the count has been a survey, run with the University of Washington. In 2024 it ran for twelve days at 20 hub sites. Each person surveyed got a $20 gift card and three paper coupons to hand to people they knew who were also homeless; each coupon that came back as a survey paid them $5 more. In all, 1,466 people living outside were surveyed, and statisticians weighted those answers into the estimate of 9,810 people outside countywide. People in shelter are counted from the shelters' own records instead.
The Eastside's 1,114 rests on 176 surveys taken at five sites. KCRHA publishes no margin of error for it, so it reads as a count when it is an estimate.
Why the chart you've seen is probably wrong
HUD, which requires the count, publishes a King County figure every year. But the county only counts people outside every other year, and in between HUD repeats the last number. 2023's unsheltered figure is 2022's, to the person; 2025's is 2024's.
The flat stretches in HUD's file are years nobody counted
Unsheltered people in King County, the same HUD figures drawn twice. On the left, every year HUD publishes, joined. On the right, only the years an unsheltered count actually happened. The marked points — 2023, 2025 — repeat the prior year's estimate unchanged, because the count runs every other year and the figure is carried forward. The left panel shows two flat stretches that no count supports, and it is what an annual read of HUD's own file produces. Source: HUD per-CoC Point-in-Time and Housing Inventory Count reports for WA-500 Seattle/King County, 2015-2025 (HUD Exchange); subregional figures from KCRHA.
Plot HUD's file as it comes and you get two plateaus that no count measured. Three other breaks sit in the same series. 2021 has no outdoor count at all, waived for COVID. 2022 switched to the survey method and was taken on 1 March instead of late January. And the Eastside itself was redrawn, in 2018 and again in September 2024, so the rise from 1,032 people in 2020 to 1,910 in 2024 mixes a new boundary, a new method and a real change, with no way to separate them.
School districts count differently again. Bellevue School District identified 438 homeless students in 2025-26. Schools count children whose families are doubled up with relatives or friends, three in four homeless students statewide, and HUD's count leaves them out by design. Both numbers are right; they measure different things.
Do the beds keep up?
Countywide, no. Counted the same way in both years, the homeless count rose 26% from 2022 to 2024 while the emergency-shelter and transitional-housing beds meant to take people in fell 6%. Under the older counting method the count also outgrew the beds. 2023 and 2025 are left out because their outdoor figures repeat the year before, as above. The 2026 count rose again, to 18,365; so far that year's beds are published only for emergency shelter, which lost 689.
Since 2022 the count rose by about 5,000 people. Crisis beds stayed between 6,900 and 7,700.
People in shelterPeople outsideEmergency + transitional beds
King County. Each bar is one count: people in shelter at the bottom, people outside on top. The line is the emergency-shelter and transitional-housing beds on the night of the count. The count changed method in 2022 (dashed line), so compare bars on the same side of it. 2021 had no outdoor count, and 2023 and 2025 only repeat the outdoor figure from the year before, so they get no bar. For 2026 only emergency-shelter beds are published so far, so the line stops at 2025. Beds are inventory, not beds a given person could use. Sources: HUD per-CoC Point-in-Time and Housing Inventory Count reports for WA-500 Seattle/King County, 2015-2025 (HUD Exchange); subregional figures from KCRHA; 2026 from KCRHA 2026 Point-in-Time Count, Executive Report p.2 and p.8, initial release.
Emergency-shelter beds alone more than doubled from 2015 to 2025, 2,828 to 5,958, and that is the figure that gets quoted. It misleads, because transitional housing fell by half over the same years, 3,579 to 1,712, and some of the emergency growth is transitional beds under a new label. Nothing published says how many, so this page counts the two together: a bed that changes category has not been added.
The two crisis-bed types, King County. Emergency shelter went from 2,828 to 5,958 beds while transitional housing went from 3,579 to 1,712. Most of the emergency-shelter growth is transitional housing arriving under a different label, which is why the two are reported together everywhere else on this page. Source: HUD per-CoC Point-in-Time and Housing Inventory Count reports for WA-500 Seattle/King County, 2015-2025 (HUD Exchange); subregional figures from KCRHA.
Permanent supportive housing did grow, 4,675 beds to 8,034, and rapid re-housing 1,326 to 2,388. Those are real additions, but HUD leaves people in permanent supportive housing out of the homeless count, so they answer a different part of the problem.
On the Eastside the beds that existed were not full: on the night of the last count, 796 people were in 1,018 beds while an estimated 1,114 slept outside. Those 222 empty beds are not spare capacity. Beds carry rules that a particular person outside may not meet, on age, gender, sobriety or household, and the count's report names couples as a gap here.
The Eastside has 1.9 people for every shelter bed, the same as the Seattle Metro area; North King County has 9.6. Its shortfall is in the mix of beds more than the number.
What happens next
KCRHA publishes the full 2026 report, with the Eastside's figure, later this year. The authority itself is shrinking. After a damaging audit in April, King County and Seattle are taking back about $160 million of the shelter and service contracts it ran, from January 2027, but KCRHA keeps the count. Mary's Place plans a 200-bed family shelter in Burien in mid-2027; no Eastside replacement has been announced.
How this was checked
Checks against this finding
Which published county years can sit in a trend:
Year
What is wrong with it
2015, 2017–2020
Usable, counted by volunteers in late January. The older method undercounted. 2016 is not in the HUD reports used here.
2021
No unsheltered count. The total is sheltered people only.
2022
Counted on 1 March, and the first year of the survey method.
2023
Unsheltered figure is 2022's, carried forward unchanged.
2024
Counted, with the survey method.
2025
Unsheltered figure is 2024's, carried forward unchanged.
Of those ten years, 3 of 10 (2021, 2023 and 2025) cannot sit in a trend beside the others. On this site, trend lines join only the other years and those three appear as separate points.
Is there really no margin of error? None in the 2024 report's method, results, Eastside profile, limitations or charts, read page by page, nor in the 2026 initial release, its FAQ or KCRHA's dashboard. The academic papers behind the method (Almquist and colleagues, University of Washington) were not read and may carry one.
Do the Eastside's figures add up to the county's? Not quite: the seven areas sum to 16,750 against 16,868. Surveys taken by phone through the family line carry no location, so a share computed against the county total comes out slightly low.
How big was the 2018 boundary change? Issaquah and Sammamish moved into East County; the 2019 report puts the shift at 35 people. The September 2024 redefinition into seven areas is the larger one and is not sized anywhere.
Is bed inventory the same as beds available? No. The inventory counts beds that exist on one night in programs that report to the county's homelessness system. It says nothing about whether they were staffed or reachable, and it misses privately funded beds and church rotating shelters.
Is 2022 a fair starting point for the beds comparison? It was counted on 1 March rather than in late January, so it carries a seasonal offset of unknown size and direction.
Why does the beds comparison stop at 2025? HUD's files do not carry the 2026 count yet. The section began as a page of its own in September; its correction is on the corrections page→.
2026 volunteers. KCRHA's two 2026 documents disagree, 200 volunteers at 25 sites against 150 at nearly 30, so neither figure is used above.
What is not claimed
That homelessness on the Eastside rose or fell since 2020. The boundary and method changes make that unanswerable from published figures.
That beds should match the count one for one. Some people are better served by permanent housing than by a shelter bed.
Why the count rose. Rents, migration and the method's reach all bear on it, and this page measures none of them.
An Eastside figure for 2026. It has not been published.
That the $20 survey method is worse than the old count. KCRHA and HUD judge it more complete; its weakness here is only that its uncertainty is not published.
Sources (8)
Sources
First published 2026-09-09 as a guide to six traps in the data; rewritten 2026-10-07 around the Eastside.
HUD Point-in-Time and Housing Inventory Count reports for King County (continuum of care WA-500), 2015 to 2025.
KCRHA Point-in-Time reports for 2019, 2020, 2022, the revised 2024 report (East King County profile, pp. 88–90; method, pp. 12–29) and the 2026 executive report and FAQ.
City of Bellevue pages on the Eastside Men's Shelter and the Safe Parking Pilot.
The Sophia Way.
Mary's Place, "Behind every number is a child" (July 2026).
Plymouth Crossing's unit count and the contract transfer figures as reported by the Seattle Times, 425 Business and MyNorthwest.
The joint statement of King County's executive and Seattle's mayor, 3 August 2026.
Washington OSPI homeless student data.
Updates and corrections.
Updated 5 Nov 2026. Adds whether shelter beds keep up with the count, from an earlier page folded into this one, with the 2026 count and a map of the cities the count covers.
This page takes in an earlier one, “Since 2022, King County's homeless count rose 26%. Crisis beds did not keep up”, which was corrected. What changed→
New stories from Bellevue, in your inbox
One email when a new story is published, with any corrections. Nothing else.