Getting around
How much of Bellevue is parking lot
7 min read
Where the city's own forecast says evening rush hour will be too busy, from downtown to the Coal Creek ramps, and what the Transportation Commission may recommend on 12 November.
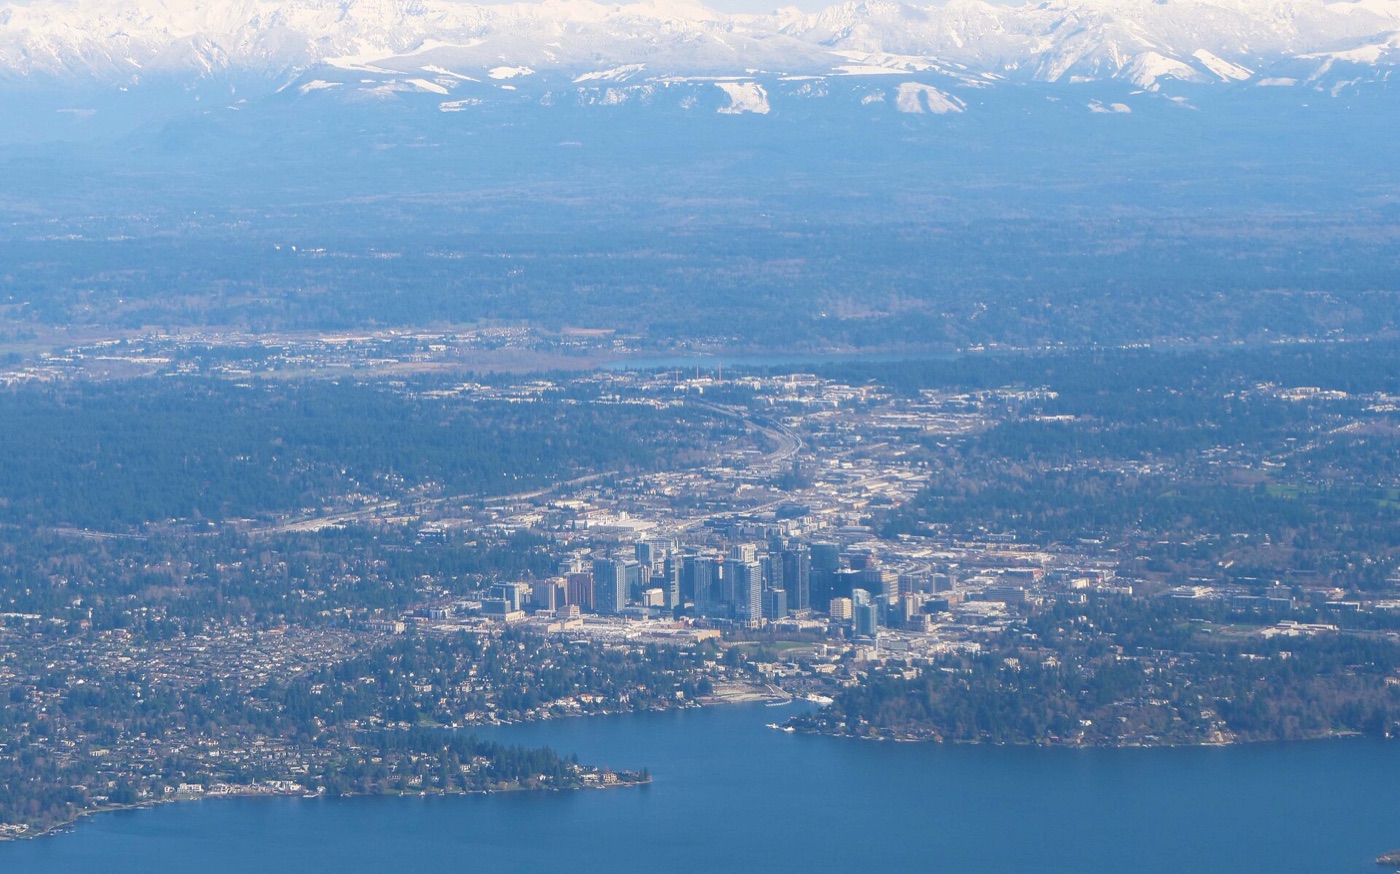
Bellevue sets a limit on how busy each traffic-light intersection should get at rush hour. Its transportation plan, adopted last November, forecasts the evening rush in 2045 and finds 18 intersections over that limit. Those 18 are where the city looks first when it decides which roads to study, retime or rebuild.
The busiest is where NE 8th Street meets 112th Avenue NE, beside I-405 downtown. Most of the rest sit on 116th Avenue just across the freeway, on 148th Avenue in east Bellevue, and near I-90 and I-405 in the south.
Each number is how full an intersection gets in the evening rush: the traffic passing through it divided by what it can handle. 1.00 is full. The limit is how full the city allows, lower outside downtown. Over the limit is too busy by the city's standard, which is not the same as gridlock.
| Intersection | Limit | Base year | 2045 |
|---|---|---|---|
| 112th Ave NE & NE 8th St | 1.00 | 1.05 | 1.29 |
| 116th Ave NE & NE 4th St | 1.00 | 0.89 | 1.20 |
| 116th Ave SE & SE 1st St | 1.00 | 0.88 | 1.15 |
| 116th Ave NE & NE 8th St | 1.00 | 0.72 | 1.12 |
| 120th Ave NE & NE 12th St | 1.00 | 0.80 | 1.07 |
| 116th Ave NE & NE 12th St | 1.00 | 0.71 | 1.04 |
| 148th Ave NE & Bel-Red Rd | 1.00 | 0.99 | 1.04 |
| I-405 southbound ramps & Coal Creek Pkwy (state) | 0.90 | 0.82 | 1.06 |
| I-405 northbound ramps & Coal Creek Pkwy (state) | 0.90 | 0.86 | 0.96 |
| 142nd Ave SE & SE 36th St | 0.90 | 0.62 | 0.97 |
| 140th Ave NE & NE 8th St | 0.85 | 0.88 | 0.96 |
| 148th Ave NE & NE 8th St | 0.85 | 1.02 | 0.95 |
| 116th Ave NE & Northup Way | 0.85 | 0.85 | 0.94 |
| 115th Pl NE & Northup Way | 0.85 | 0.89 | 0.94 |
| Coal Creek Pkwy SE & SE 60th St | 0.85 | 0.93 | 0.93 |
| 148th Ave & Main St | 0.85 | 0.99 | 0.92 |
| 148th Ave SE & Lake Hills Blvd | 0.85 | 0.84 | 0.87 |
| 112th Ave SE & Bellevue Way SE | 0.85 | 0.82 | 0.86 |
The base-year column is from Appendix D, labeled 2024; another passage of the plan says 2023. These are older measurements, not current traffic counts. Downtown and 116th Avenue get much busier by 2045. On 148th Avenue little changes, and two intersections there are over their limit already.
A forecast a hair over the limit says little. Staff's November memo notes that at that precision a result "can easily swing one way or the other", and suggests focusing on intersections 10% or more over their limit, the darkest cells in the table above. Nine of the 18 pass that bar:
The other nine stay on the list. The plan treats every one as a place to look, not a decision to build.
In October the Commission gave staff preliminary direction to keep watching every intersection over its limit, except freeway ramps the state runs. On 12 November staff ask it to recommend two changes to the plan:
What follows:
Too busy is not a wait time. The plan pairs the intersection ratio with travel speed along each corridor, and a corridor can meet its speed target while one of its intersections is over its limit. Its NE 8th Street example explains why. Coordinated signals keep the main street moving while side streets get less green time. The ratio says nothing about queue length or congestion outside the evening rush.
The forecast is one scenario. It uses the regional BKRCast travel model, the growth in the plan's Appendix K, the projects in the city's 2025 Transportation Facilities Plan and other regional projects, and an assumption that a quarter of work happens from home. Staff calls it a snapshot that changes with growth and investment.
The appendices still say draft. Appendices D and H carry "DRAFT Date: 10/13/2025" inside the plan adopted on 25 November 2025. Their 18 match the plan's own Figure 27.
Staff's maps differ from the plan. The maps staff gave the Commission in October and November mark some intersections differently from the plan's tables, and differently from each other. Both show 116th Avenue at NE 8th Street, one of the nine, as within its limit. The memos do not say why, and the maps carry no labels, so this page uses the plan's tables.
The base year is uncertain. Appendix D labels its data 2024, while one passage of the plan says 2023, and the plan does not say how the counts were taken.
Updates and corrections.
Updated 5 Nov 2026. Staff's 4 November memo confirms the Transportation Commission is asked for a recommendation on 12 November and suggests focusing on intersections 10% or more over their limit, nine of the 18. The page now leads with those nine; the forecast figures are unchanged.

One email when a new story is published, with any corrections. Nothing else.
Getting around
7 min read
Getting around
5 min read

Community
11 min read