Getting around
Bellevue expects 18 intersections to be busier than its limit by 2045
4 min read
Measured lot by lot from 2023 aerial photographs, as the Council writes the rules for how much parking new buildings must provide.
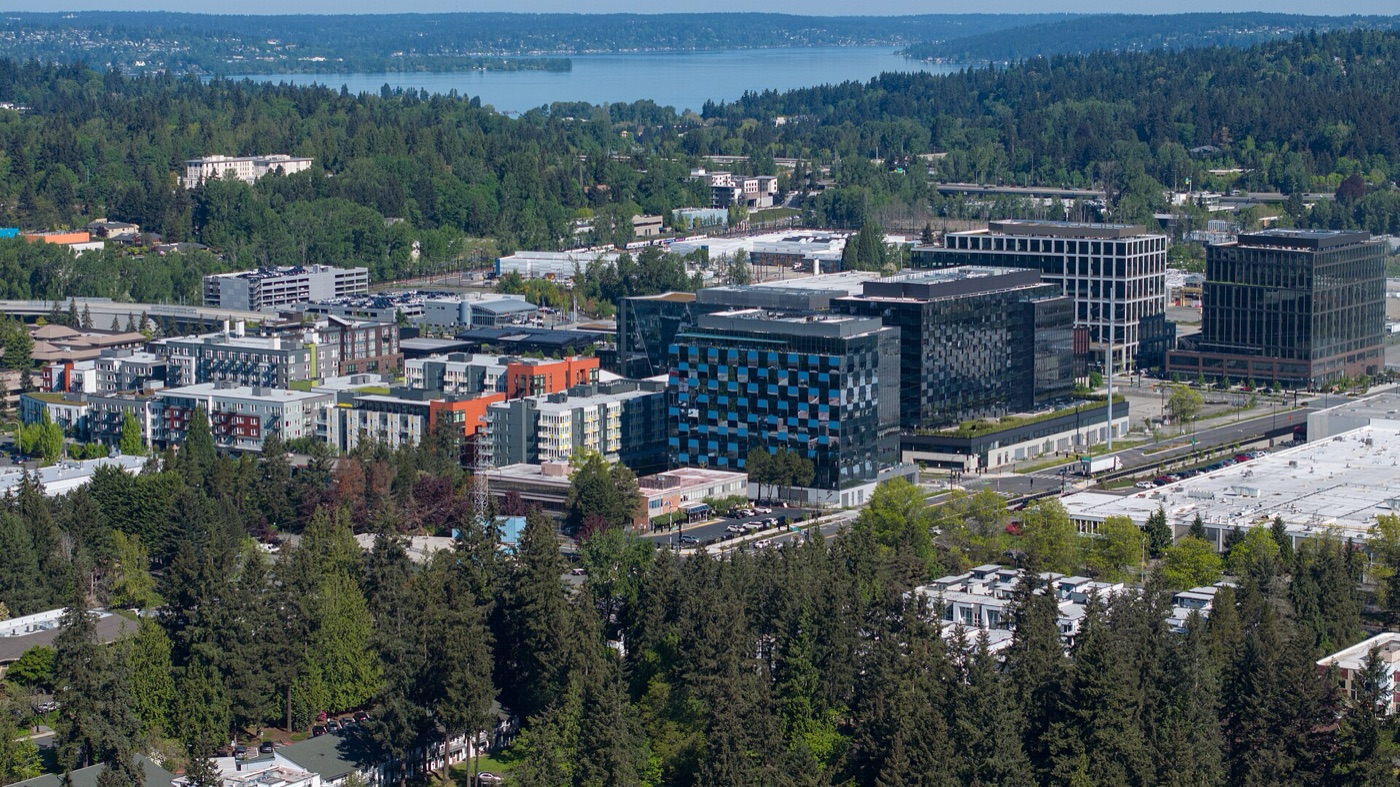
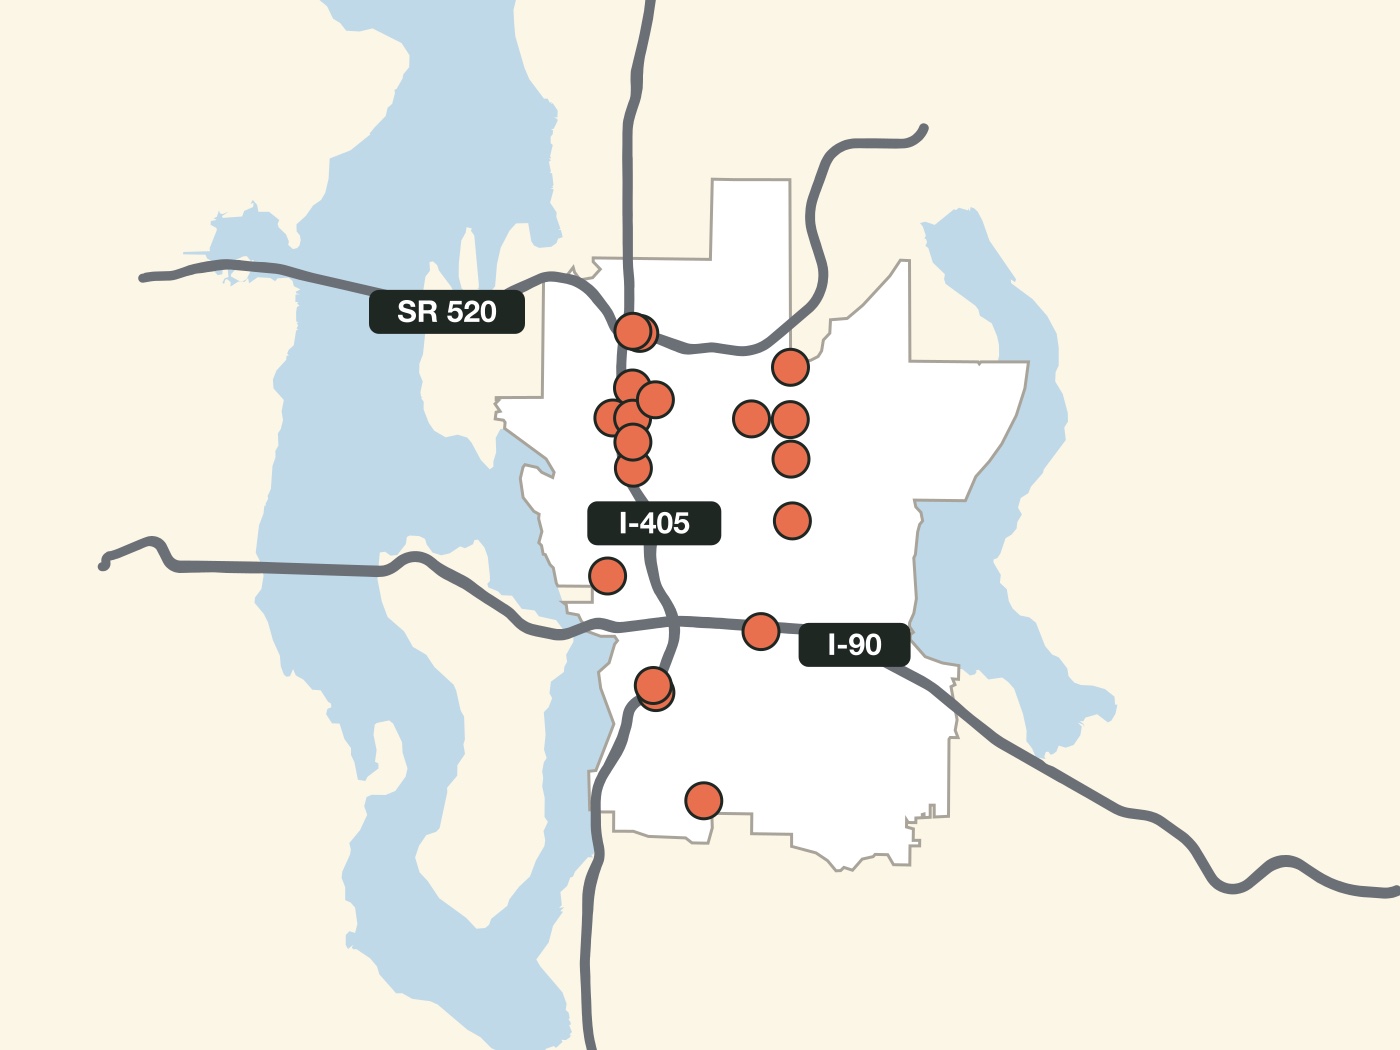
BelRed holds more of the outlined lot than any other planning area.
Outlined lots, about 241 acres, cover about 28% of BelRed's land. Its industrial history helps explain the large lots: the city's plan traces warehouses, manufacturing and services to the 1950s and 1960s, including Safeway's 1958 distribution center, and Metro's bus bases followed in the late 1970s and early 1980s. The plan now calls for a growth center built around light rail.
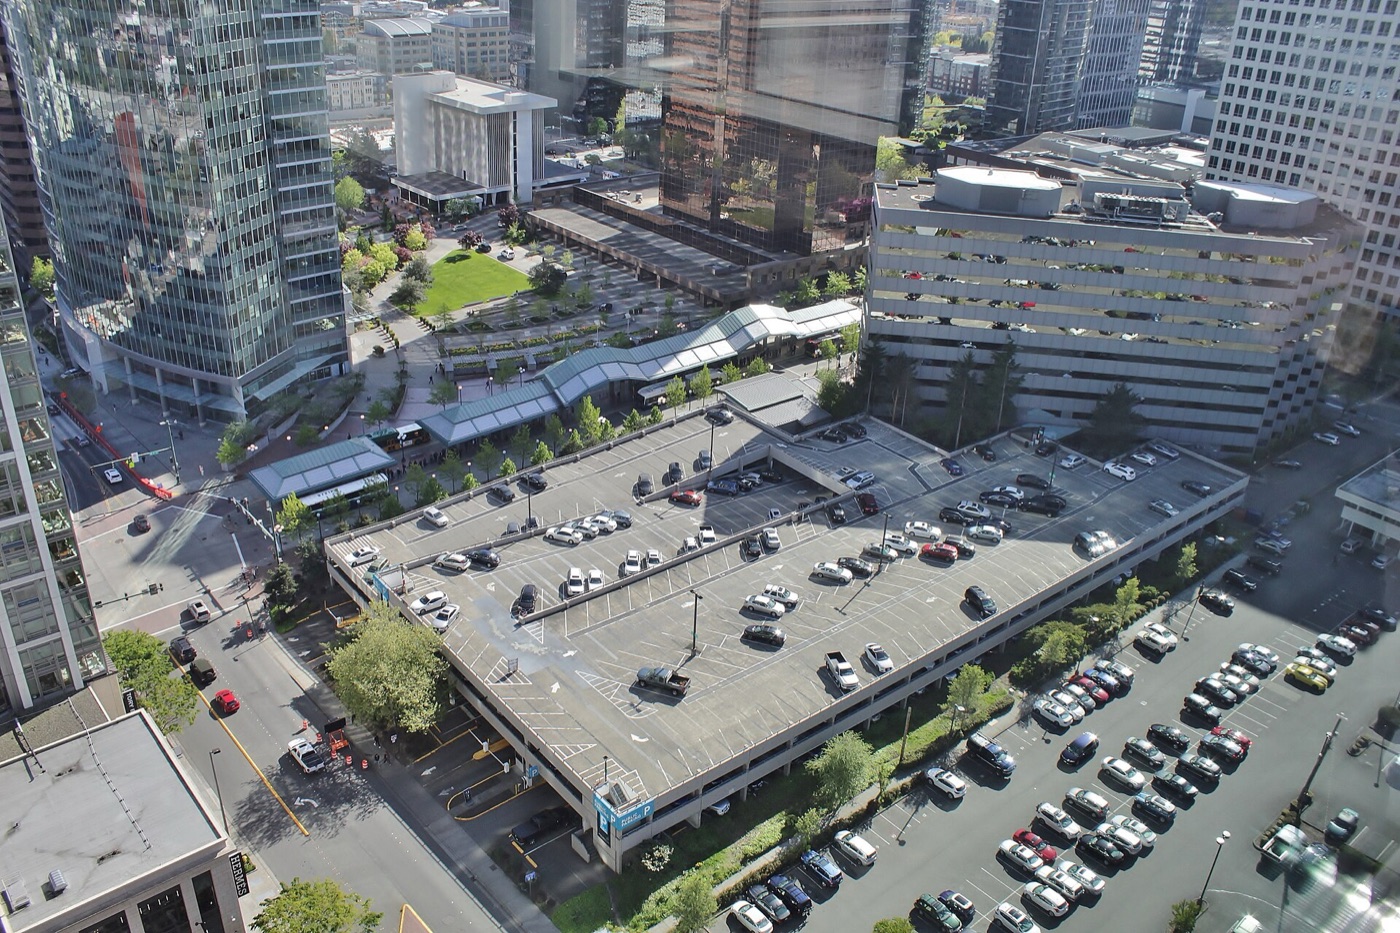
Downtown has about 53 acres of outlined lot, about 12% of downtown's land, but most of its parking is in garages. The Puget Sound Regional Council counted about 44,000 nonresidential off-street spaces in and around downtown in 2022. Even allowing a fifth more lot than the model outlined, downtown's surface lots would hold under 10,000 cars. The counts differ in date and boundary, so this is a rough check, not a measured garage share.
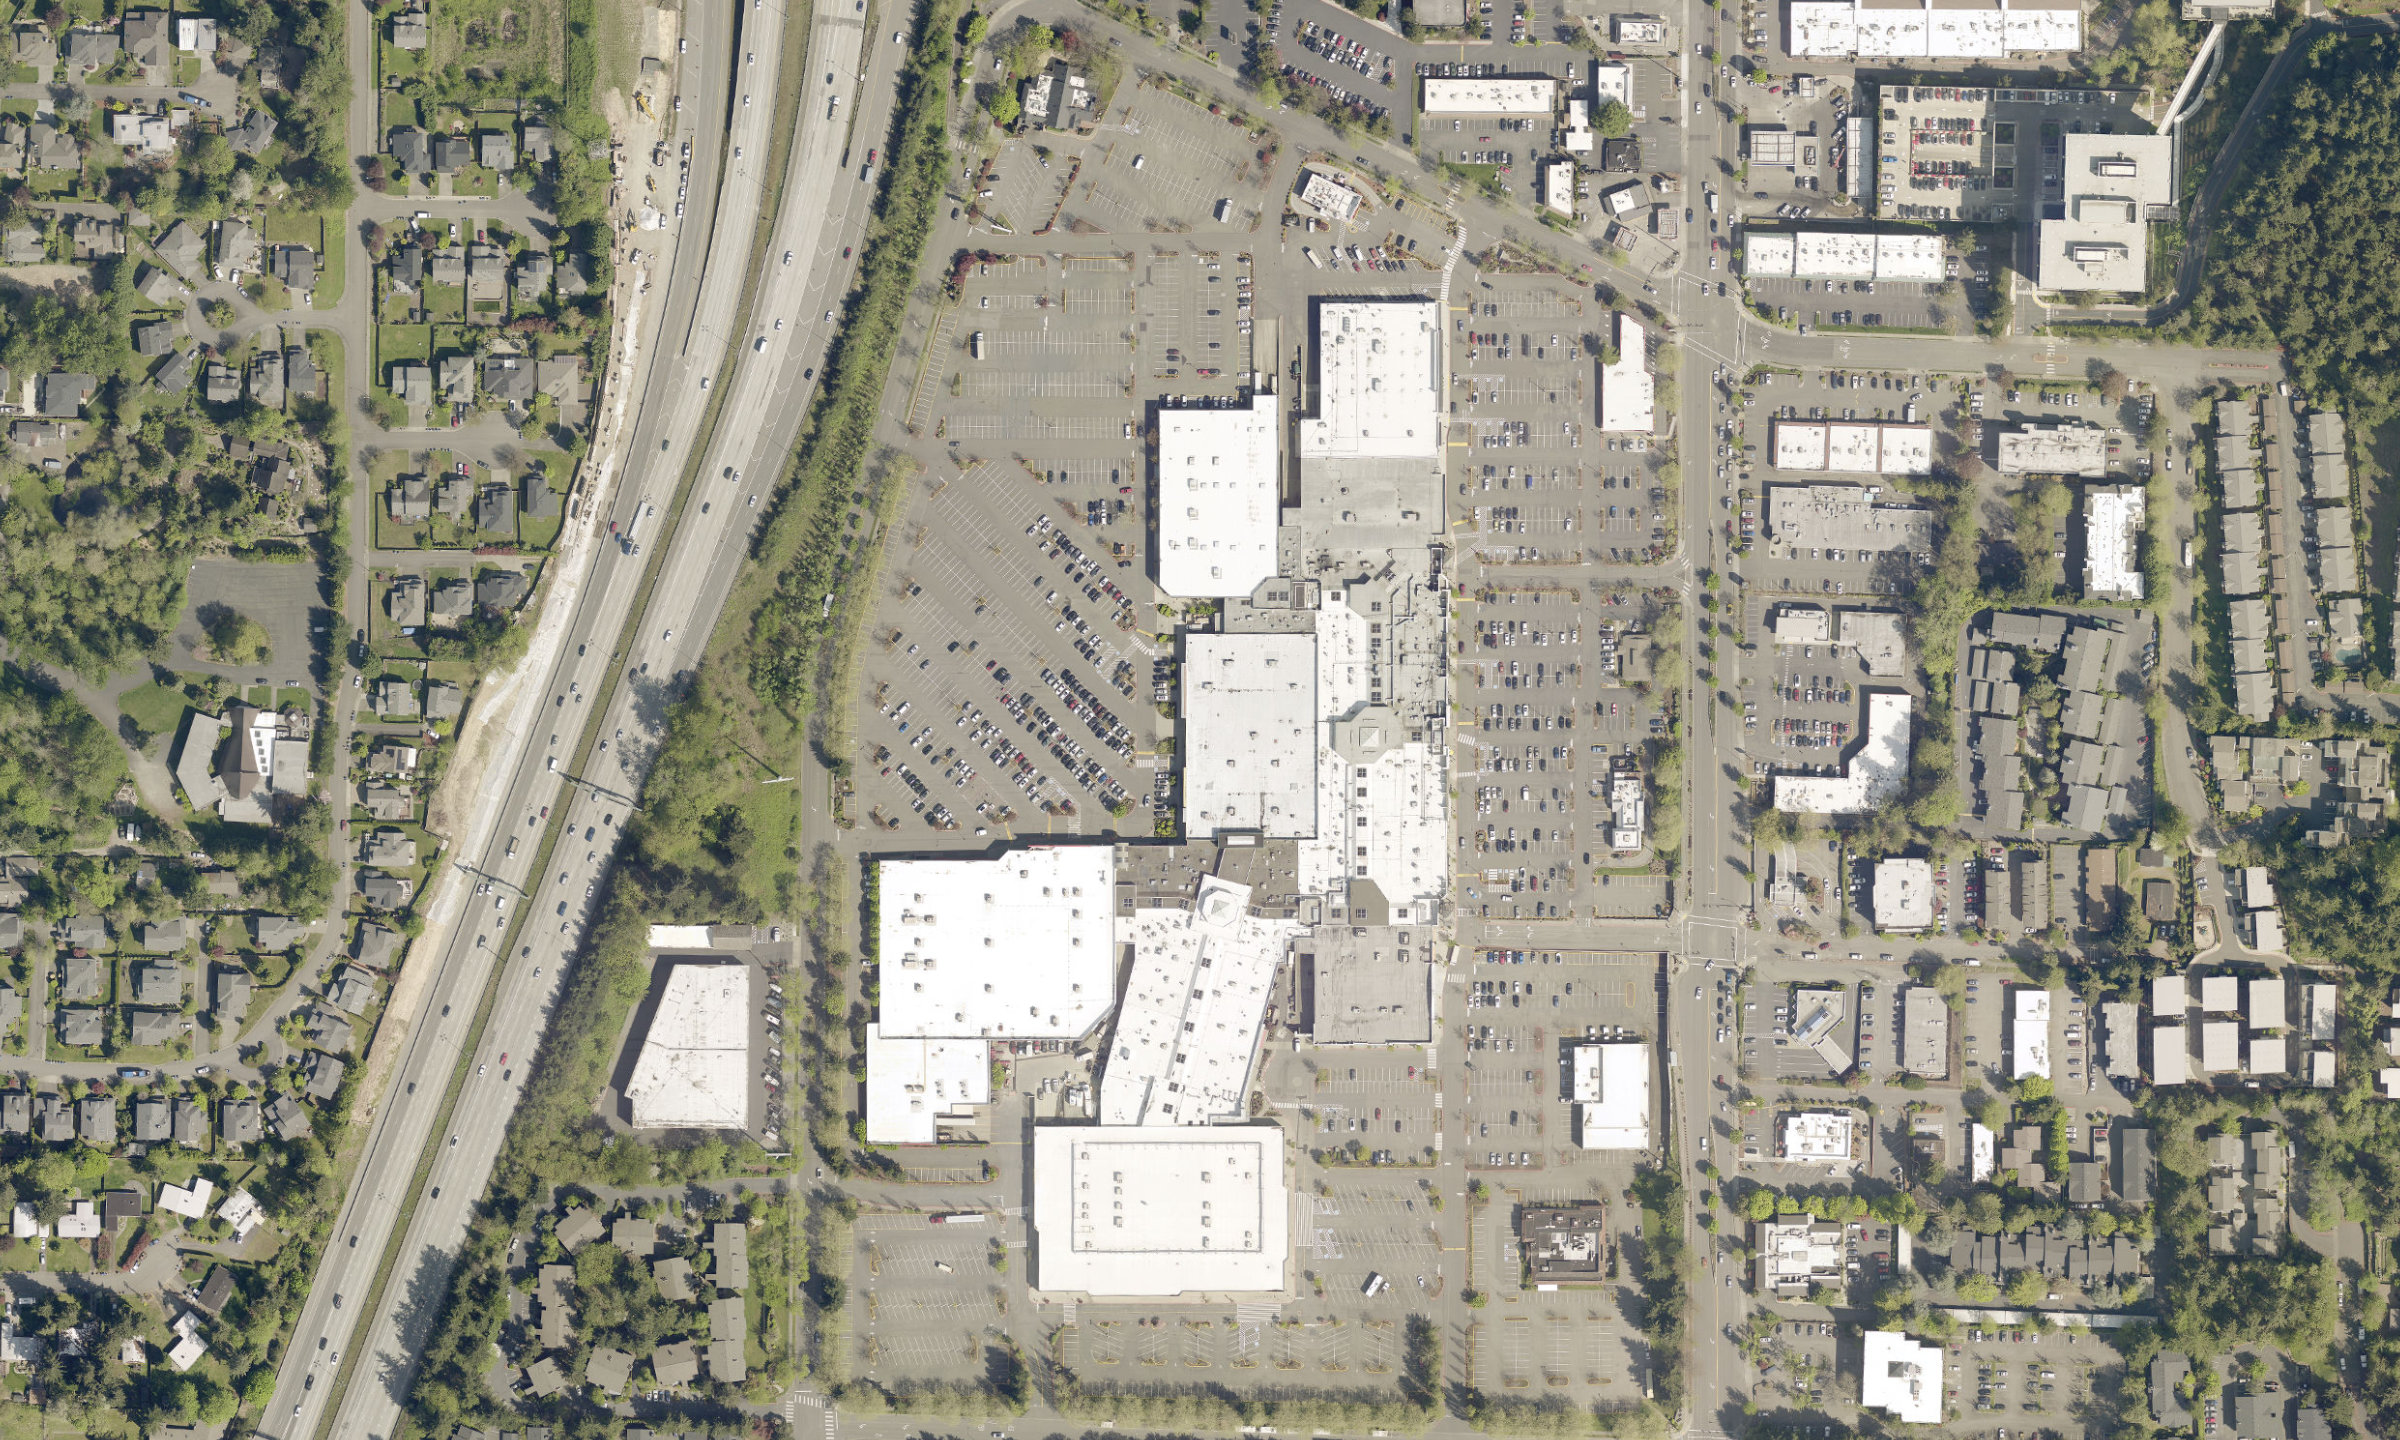
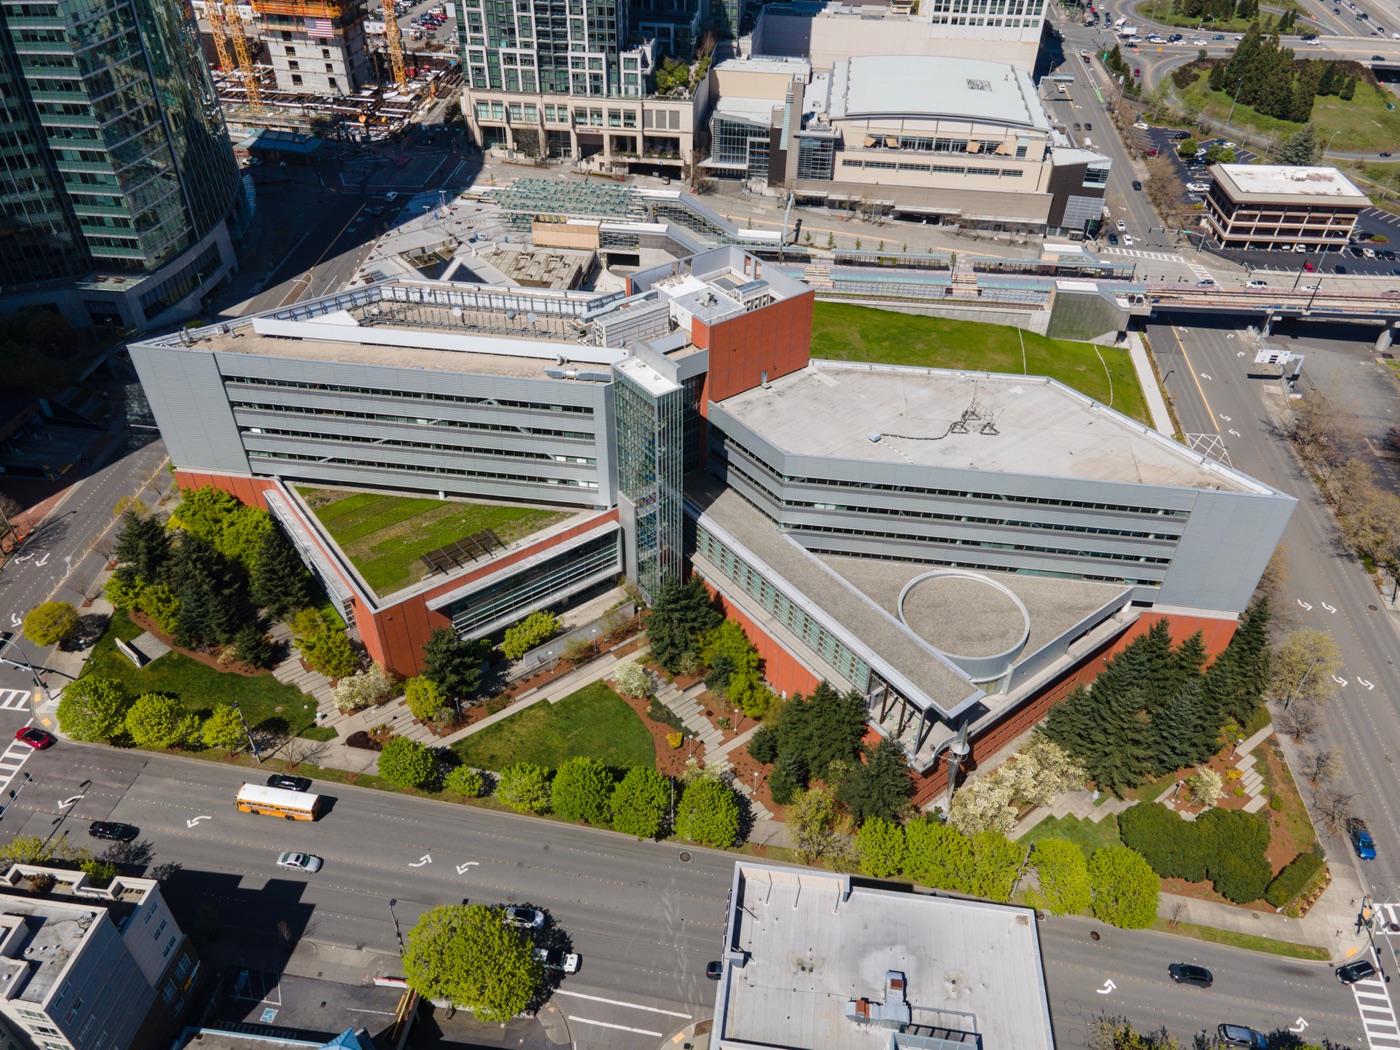
Factoria Mall is a cluster of store roofs in a field of striped asphalt: about 20 acres of surface parking on a 39-acre site, measured from the air. Factoria shows the land tradeoff clearly. The whole Factoria planning area has less than a third of BelRed's outlined lot, so this is not the mall against all of BelRed.
One site does not establish the model's accuracy everywhere. Lots under tree canopy, gravel yards and lots of parked trucks are harder to tell from roads and rooftops, which is why the citywide figure is a range and not one number.
The mall's 2020 master plan allows up to 685 homes, with a hotel and offices beside the stores. A 2024 design approval showed 265 apartments on a 5.3-acre corner that now holds a restaurant and its parking, about 50 homes an acre. That approval is not a construction schedule: the city's permit portal lists it as closed, with an April 2026 expiry, and a search found no building-permit application. The design shows what one lot could hold, not what will be built on the others.
OpenStreetMap maps 459 acres of surface parking in the whole city. On the land outside single-family lots, King County’s parking classes cover about 710 acres, the model’s outlines about 1,070, this page’s estimate is about 1,200 with a 95% range of 1,090 to 1,310, and the county’s classes with driveways about 1,340.
A computer model that reads aerial photographs outlined ground that looks like a parking lot on every Bellevue parcel that isn't a single-family lot, after buildings and streets were taken out: about 1,070 acres. Random points dropped across the same land, labelled by an AI model and then partly re-read by a person, corrected for ground the model marked wrongly and lot it missed. That gives about 1,200 acres, with a 95% range of 1,090 to 1,310; the outlines caught about four-fifths of it.
County land-cover classes bracket the estimate, but define parking differently. In King County 2023 land cover (Ecopia), the parking classes cover about 710 acres of the same land, a floor because they leave out drive aisles, and adding the driveway class gives about 1,340, a ceiling.
Measured the way a University of Illinois study of 15 US cities measures, against tax-parcel land, Bellevue's lots are about 6.9% of its 17,534 acres of parcel land (6.2 to 7.5%), against 5.1% for Seattle; Bellevue isn't in the study and the counts weren't made the same way, so that comparison is rough.
What would undermine the estimate:
Downtown renters have fewer vehicles available than BelRed renters, and the gap holds after allowing for survey uncertainty. Nearly a quarter of downtown's renter households have no vehicle, against about a tenth in BelRed; downtown's margin runs from roughly 19% to 29%. These Census estimates pool 2019–2023; they are not a single-year count.
Parking is costly to build: a February 2026 UCLA study put a Seattle garage space at about $57,000 above ground or $87,000 underground, at 2025 costs.
Near light rail, state law leaves ordinary residential parking to builders. The ownership figures describe households under the old rules; they do not show how tenants or builders will respond to the new ones.
Two 2025 state laws drive the rewrite. Near light rail, HB 1491 bars ordinary parking minimums for homes, and city staff read it as already applying; the city's station-area map covers most of downtown and the BelRed blocks around the Spring District and 130th stations. Everywhere else, ESSB 5184 caps minimums at half a space per apartment by 27 January 2027. Both limit what a city can require, not what an owner may choose to build.
The draft the Council discussed on 20 October replaces the district parking rules, downtown's and BelRed's among them, with one citywide set, and twelve kinds of development need none, including homes in a transit station area.
| Parking a building must provide | Code baseline before state-law overrides | 20 October draft |
|---|---|---|
| Apartment, downtown | At least half a space (one in 2013); none in the two office districts | Half a space |
| Apartment, BelRed | BelRed's own table | Half a space |
| Apartment, elsewhere | One space | Half a space |
| Apartment near light rail | None, under HB 1491 | None |
| Maximums | Downtown and BelRed cap parking | None for the uses listed; the Director may set one for a use not listed |
The draft's half space also applies to each middle-housing home. Before the meeting, the memo left three choices open: how far a bus rapid transit exemption reaches, how much visitor parking larger buildings need, and whether narrower stalls earn a reduction.
The Planning Commission recommended the amendment on 22 July 2026, every member present voting for it. On 20 October the Council settled the open choices member by member (draft minutes):
It then voted 7-0 to have staff finalise the ordinance for a future consent calendar. The minutes are a draft until the Council approves them, and none of this is law until that final vote.
Results will be slow to show. On 8 September Councilmember Bhargava asked for "a list of measures that tell us whether our parking reform is working" (video, 1:54:02). Bellevue's planning manager for code and policy, the amendment's staff contact, told Plat by email on 2 September that the lower standards will apply only to projects submitted after adoption, which must then be reviewed, built and occupied, so even at the three-to-five-year review there may be little to measure. Staff kept to the state minimum, the same email said, because parking demand is uncertain with light rail newly open and engagement on the project was thin. The lot outlines on this page come from aerials flown in October 2023, a before picture for that review.
The next step is a Council ordinance, due before 27 January 2027. Check the meeting calendar for its date. The card above links the city's speaking rules and written-comment address, [email protected]. Regular-meeting sign-up opens at noon for a 6 p.m. start, in person or on Zoom; speakers have up to three minutes within a limited period, with agenda items first. A slot is not guaranteed. Questions about the draft go to the planner on the city's project page.
The model. SegFormer weights trained by the University of Illinois's ParkSeg project (Qiam, Devunuri and Lehe; Apache-2.0), run on USDA NAIP imagery flown on 7 October 2023 at 0.6 m and resampled to 0.3 m. It was run on every King County parcel in Bellevue except single-family ones. Building footprints were removed, then OpenStreetMap's roads, then its mapped parking structures; garages and underground parking are outside the estimate by design.
The sample. 820 points were dropped at random across the city's commercial, office, apartment and public land, and an AI model looked at the photograph under each one and called it lot or not; a person reviewed the 30 it couldn't call in the earlier batch. The city's non-single-family land, 6,819 acres, was split into three strata. Each stratum's points were weighted back to its area:
| Stratum | Acres | Usable main-pass points | Uncertain points before human review |
|---|---|---|---|
| Inside the model's outlines | 1,074 | 185 | 15 |
| Within 30 m of the outlines | 1,977 | 263 | 17 |
| Rest of the land in scope | 3,768 | 337 | 3 |
Inside the outlines, 0.70 of points were parking as the AI recorded them (0.63 to 0.76), and 0.92 after the person's re-read; the outlines held about 82% of the parking area the points found. The thin far stratum is where much of the sampling margin comes from: a few lots found there count for a lot of acres.
The AI labelling. Inside the outlines, the first batch called 63% of points lot, the second 83%, and a third pass 76% of a mixed set of 80. The third pass agreed with the first on 68% of its points and with the second on 78% (kappa 0.43 and 0.57). The resulting estimates differed:
| Estimate version | Human input | Acres | 95% interval |
|---|---|---|---|
| First batch only | None | 834 | 712 to 963 |
| All points as recorded | None | 925 | 825 to 1,025 |
| Earlier uncertain points resolved | Person's calls on 30 unsure points | 974 | 871 to 1,077 |
| Third-pass share inside the outlines | None; AI relabelling | 993 | 840 to 1,135 |
All three passes were the same AI model on the same written definition, so their agreement isn't independent confirmation. Read the AI's way alone, the points gave about 830 to 990 acres; that is why a person re-read a sample.
The re-read. The 80 are a simple random draw from the labelled points: from each batch, 25 inside the outlines and 15 within 30 m of them. A person called each one lot, structured parking or not, in two rounds on 18 and 20 October 2026; the second round settled 17 of the 20 left open in the first, leaving 3 uncalled, which are dropped. The AI's calls were too strict: of the re-read points inside the outlines it had called about 7 in 10 parking, the person about 9 in 10, most of the difference being shaded or unstriped pavement the AI had called not-a-lot. Within each batch and stratum, the share of each AI label that the person called lot is applied to every point carrying that label (a two-phase, or double-sampling, correction); points far from the outlines weren't re-read and keep their AI labels. That gives 1,206 acres, with a bootstrap 95% interval of 1,085 to 1,311, which the published range rounds. Against the person's calls, the third AI pass got lot-or-not right on 39 of 49 points inside the outlines, and 9 of its 10 misses were lots it called not-a-lot.
The county's land cover. King County's 2023 land-cover layer was read on 20 October 2026 and clipped to the same 6,819 acres. Its parking and unpaved parking classes cover 709 acres; its driveway class adds 630. Only acreage is used here.
Factoria. The mall's parcels hold 39.2 acres. The model marked 21.8; a stall count from the striping (about 2,570 stalls at about 135 per acre) gives 17 to 21. At this mall, the stripe check put about 85 to 90% of the outlined ground in parking; that is not an accuracy rate for all large lots.
Against other counts. OpenStreetMap maps 459 acres of surface parking in Bellevue (read 18 October 2026), 2.1% of the city's 21,434 land acres; this estimate is about two and a half times that. We found no published Bellevue-wide figure for surface-parking land (searched October 2026: the University of Illinois's 15-city study, which covers Seattle but not Bellevue; Parking Reform Network's lot map, whose page refused our request; USGS, PSRC and City of Bellevue documents). A commercial US-wide lot dataset exists and may include Bellevue; we didn't buy it. Seattle's 5.1% in the Illinois study is a share of tax-parcel land, so the page compares it with Bellevue's lots as a share of the 17,534 acres of King County parcels on the city's land, leaving out the two lake parcels and the submerged parts of shoreline parcels (parcels read 18 October 2026). If the Illinois count includes lots on single-family parcels, which this one leaves out, Bellevue.s share on their method would be somewhat higher. The study's 15 cities run from 3.4% in Oakland to 10.7% in Anaheim.
Factoria's plan. Homes, acreage and stalls are from the city's design review approval for Phase 1 (file 22-130386-LD, read 20 October 2026), on the city's parcel for 12405 SE 38th Street: a five-story building, with the corner's cars moved into a five-level garage inside it, 366 stalls, and a smaller lot kept to the south. The 685-home ceiling is from the 2020 master development plan staff report. 50 homes an acre is 265 divided by 5.3 acres; at that rate each 10 acres of lot rebuilt the same way would hold about 500 homes. One site's density says little about another's, because what can be built depends on each lot's zoning, and we haven't measured how much of the 1,200 acres sits in zones that allow apartments: the city's Land Use Code site refused our automated reads, so that share isn't given here.
| Record | Date | What it establishes |
|---|---|---|
| Master development plan | 2020 | A ceiling of 685 homes, with a hotel and offices beside the stores |
| Phase 1 design review | Issued 4 April 2024 | 265 apartments on a 5.3-acre corner, about 50 homes an acre |
| Permit portal fields, checked 28 October 2026 | Expiration 4 April 2026; status Closed | The displayed design-review fields, not the legal status of the separate master plan or every possible extension |
| Building-permit search | 20 October 2026 | No application found in that search; later applications and extensions have not been verified |
Commenting. The sign-up times, speaking time and email address were read on the city's oral communications page on 20 October 2026.
The stall range. A rough mixed-geography illustration adds to 175,000 to 260,000 off-street spaces; it is not a Bellevue city-limit inventory.
| Component | Conversion | Geography and limits |
|---|---|---|
| Surface: about 130,000 to 197,000 | 1,090 to 1,310 acres at 120 to 150 stalls per acre, including aisles | Sampled Bellevue non-single-family land; excludes park-and-rides and street parking |
| Garages and underground: 45,000 to 65,000 | Assessor parking floor area at 300–350 sq ft per above-ground stall and 400–500 below ground | Bellevue ZIP codes, not city limits; October 2026 extract; assumes recorded square feet total all floors |
The garage estimate can include land outside Bellevue and miss parking not recorded as a separate building section. Single-family garages, driveways, on-street spaces and unrecorded tenant decks are outside the combined range. Neither component is a stall count, and their boundaries differ.
The draft. Read against the strike draft's page images on 20 October 2026. The citywide minimums are on page 9 (subsection F.1), the twelve exempt uses on pages 8 and 9 (subsection E), the Director's power to set a maximum for an unlisted use on pages 9 and 10 (F.1.f), and the surplus-parking exception on page 8 (C.1): the parking-only rule "shall not apply to the permanent removal or repurposing of surplus parking spaces that exceed applicable minimum parking requirements following an authorized change of use or tenant improvement, provided such configurations are approved by the Director." Downtown's parking section (LUC 20.25A.080), whose current text says a development "shall provide at least the minimum and may provide no more than the maximum," is marked for deletion on page 20, and BelRed's (20.25D.120), with its minimum and maximum table, on page 27. Visitor parking, one space per 20 homes for buildings of seven or more, is on page 10 (F.2.a) and applies even to exempt uses.
Existing lots. For a lot that already exists, parking stays parking, with one opening: after an approved change of use or remodel, an owner may remove or repurpose spaces above the minimum if the Director approves (the surplus-parking exception above). Spaces the code still requires stay.
The memo and the law. The agenda memo for 20 October set out the three pre-meeting choices with staff's recommendations (pages 1 to 4), names the bills the amendment carries out (SB 6015 of 2024, SB 5184 of 2025, and the parking parts of HB 1491 and HB 1183 of 2025) and says final action will come "at a future date, in advance of the January 27, 2027 state deadline"; its timeline gives the dates in the table and marks final action "TBD". The staff case for visitor parking rests on the city's 2022 to 2024 curb data, which found downtown's curbs very full; the packet has no count of off-street spaces and no measure of lot area. ESSB 5184 is chapter 204, Laws of 2025, effective 27 July 2025; its section 3 sets the caps and exemptions for code cities of more than 30,000 people, Bellevue among them, and gives those of 50,000 or more 18 months from that date, which is 27 January 2027 (session law read on the Legislature's site, 20 October 2026). The memo's "large stall" incentive is a 10% reduction for a building whose stalls are mostly 9 feet wide; a garage-clearance cleanup, the memo's fourth topic, isn't a choice and isn't counted.
| Law | Change | Timing for Bellevue |
|---|---|---|
| ESSB 5184 (2025) | Caps ordinary mandatory minimums at half a space per apartment, one per house and two per 1,000 sq ft of commercial space; exempts several uses | Compliance due 27 January 2027 |
| HB 1491 (2025), RCW 36.70A.842 | Bars ordinary residential or mixed-use parking minimums within defined station areas; disability and short-term delivery spaces are exceptions | City staff read it as already applying |
| Issue | Alternatives in the memo |
|---|---|
| Bus rapid transit exemption | Quarter-mile or half-mile reach; staff recommended a quarter mile |
| Visitor parking for seven or more homes | Commission: one space per 20 homes; staff: lower rate above 100 homes; no visitor minimum was another option |
| Wider stalls | Whether mostly 9-foot stalls earn a 10% reduction in required spaces |
By area. The outlines were clipped to the City of Bellevue's Neighborhood Areas layer, the 16 planning areas of the Comprehensive Plan, read 20 October 2026. Outlined acres: BelRed 240.7, Eastgate 155.5, Wilburton 111.9, Crossroads 103.2, Factoria 73.0, Downtown 53.3, and 336.2 in the other ten areas (Lake Hills 76.5, West Bellevue 69.5, Northwest Bellevue 55.1, Bridle Trails 52.8, Newport 31.3, the rest under 15 each). Every outlined acre falls inside some area. Downtown's area is 432 acres and BelRed's 861, so the outlines cover about 12% and 28% of them. These are outlines before correction: the random points weren't drawn by area, so the correction can't be applied area by area, and if the model misses more lot in one kind of place than another, say under trees in residential areas, the shares shift.
BelRed's history. From the city's BelRed Subarea Plan (September 2024), pages 11 and 14, including the quotation.
Downtown's stalls. The Puget Sound Regional Council's 2022 parking summaries count 43,787 off-street stalls in 215 facilities in the Bellevue downtown survey area, public and private, surface and garage together, with parking for residents excluded; 39,893 are in the four downtown census tracts and the rest in three tracts at its edges. Its 2018 count was 45,678. The 2018 count moved from fieldwork to online sources, so the years aren't strictly comparable. "Under 10,000 cars" is 53.3 acres times 1.2 times 150 stalls an acre, about 9,600. The curb pricing strategy's 55,000 is the consultants' figure; they say they didn't survey off-street parking themselves.
| Measure | Year | Geography | What it leaves out |
|---|---|---|---|
| 53.3 acres of outlined surface lots | 2023 imagery | Downtown planning area, 432 acres | Garages and underground parking |
| 43,787 off-street stalls in 215 facilities, PSRC | 2022 | Downtown survey area, including edge tracts outside the planning area | Residential parking; no surface/garage split |
| About 55,000 private off-street spaces, city curb strategy | November 2025 report | Urban core: downtown, Wilburton and BelRed | Not a new field count; consultants did not survey off-street parking |
Car ownership. From the Census Bureau's American Community Survey, 2023 5-year estimates, table B25044 (vehicles available by tenure), renter households only: owner households own more cars, and the rules in question are mostly about apartment buildings. Downtown, BelRed and Crossroads group four, three and two census tracts, so that no figure rests on one tract's margin; the citywide 1.25 uses the same calculation on place-level data. The five-or-more-vehicle bin is represented as five, so these means are top-coded approximations and can understate actual vehicles available. Downtown is below one car per household, not inside the noise: its 90% interval is 0.86 to 0.96. BelRed's is 1.38 ±0.15. Crossroads, 1.08 ±0.17, spans one car per household and can't be called above or below it. This is one Census release, kept on one side of the 2022 change in the survey's tables, so it isn't a trend, and tracts mix housing types and ages, so it says nothing about a particular building.
| Area | Vehicles per renter household ±90% margin | No-vehicle share ±90% margin |
|---|---|---|
| Downtown Bellevue | 0.91 ±0.05 | 23.9% ±4.7 percentage points |
| BelRed corridor | 1.38 ±0.15 | 10.9% ±4.5 percentage points |
| Crossroads | 1.08 ±0.17 | 20.5% ±5.8 percentage points |
Downtown's estimated 8,746 renter households have a 90% margin of ±768. Seattle (0.95 ±0.02 vehicles per renter household) and Renton (1.39 ±0.05) are the chart's citywide reference points; Bellevue as a whole averages 1.25 ±0.04. Among the fourteen cities below, Seattle alone averages below one; that is a comparison within this set, not a statewide ranking.
What the ownership figures don't say. They aren't targets. Car ownership responds to how much parking is built, so ownership measured under the old rules doesn't predict ownership under new ones, and read as targets the figures lead somewhere absurd: the logic that lowers downtown's requirement to 0.91 raises Kirkland's to 1.44. Cars owned isn't parking demand either; it leaves out visitors and cars parked elsewhere, and says nothing about peak use. It is the best public proxy, not a measurement. Low ownership downtown may reflect who chooses to live there as much as what the place does to them, and these figures cannot establish how BelRed's builders will respond.
Fourteen cities. Renter households, the share with no vehicle available, and vehicles per renter household, each with its own approximate 90% margin. Household margins combine the six vehicle-bin margins in quadrature; share margins use the ACS subset-proportion formula (ratio fallback if its radicand is negative). These approximations do not account for all survey covariance. Percentage-point margins are marked pp; a difference within its margin is not a finding.
| City | Renter households ±margin | No vehicle ±margin | Vehicles per household ±margin |
|---|---|---|---|
| Seattle | 196,825 ±3,591 | 30.8% ±0.8 pp | 0.95 ±0.02 |
| Redmond | 17,540 ±987 | 12.1% ±2.1 pp | 1.18 ±0.04 |
| Mercer Island | 3,364 ±474 | 16.9% ±7.1 pp | 1.19 ±0.05 |
| Bellevue | 29,534 ±1,370 | 15.9% ±1.7 pp | 1.25 ±0.04 |
| Spokane | 40,273 ±1,574 | 20.3% ±1.9 pp | 1.28 ±0.04 |
| Tacoma | 39,868 ±1,616 | 17.2% ±2.0 pp | 1.33 ±0.04 |
| Issaquah | 6,757 ±731 | 10.4% ±3.3 pp | 1.37 ±0.07 |
| Renton | 18,619 ±1,085 | 15.5% ±2.6 pp | 1.39 ±0.05 |
| Everett | 22,123 ±1,166 | 13.3% ±1.9 pp | 1.42 ±0.05 |
| Kirkland | 14,510 ±972 | 11.0% ±2.0 pp | 1.44 ±0.07 |
| Vancouver | 39,993 ±1,532 | 11.7% ±1.1 pp | 1.47 ±0.05 |
| Kenmore | 2,731 ±395 | 17.7% ±8.2 pp | 1.52 ±0.11 |
| Bothell | 6,895 ±663 | 11.4% ±2.9 pp | 1.54 ±0.09 |
| Sammamish | 3,661 ±547 | 2.8% ±2.1 pp | 1.70 ±0.12 |
Commuting. Including work from home changes the denominator. Downtown's drive-alone share is about 30% ±3.9 percentage points of all workers; about 38% ±5.4 points work from home. Among those who commute, the drive-alone shares are:
| Area | Drive alone among commuters ±90% margin |
|---|---|
| Downtown Bellevue | 48.1% ±11.1 percentage points |
| BelRed corridor | 59.8% ±15.6 percentage points |
| Crossroads | 77.4% ±21.5 percentage points |
These B08301 estimates cover workers, not renter households. Margins aggregate tract margins in quadrature, use workers minus home workers as the commuter denominator (adding their squared margins), then the ACS subset-proportion formula. They are approximate, not evidence of a change over time; overlapping margins do not establish a difference between areas.
Today's rules. Which parts of Bellevue are station areas is read from the city's own map (September 2026 Council packet, Attachment C), not parcel by parcel; that the state rule already applies, before Bellevue's code changes, is city staff's reading in the same packet. Downtown's half-space minimum is in LUC 20.25A.080. When it fell from one space to half we haven't pinned: a city-commissioned study in 2013 reproduced the table at 1.0.
The cost of a space. UCLA's figures for Seattle are averages of Rider Levett Bucknall's high and low 2025 construction cost estimates. King County Metro's Right Size Parking project found that the county's apartment buildings had on average 0.4 more spaces per apartment than cars parked in them; that surplus is a countywide average from Metro's 2012 field counts, published in 2013, not a Bellevue figure.
The July packet and the October memo. The Planning Commission's packet of 22 July 2026 said the proposal was "limited to state-required changes to allow time to evaluate implementation outcomes before considering future local amendments," and staff estimated that three to five years of data would be needed; the Commission voted 5 to 0 with two members absent. The 20 October memo describes it more broadly, as carrying out four state bills and the city's own plan policies on parking near transit: ESSB 5184 and three other state bills on parking.
The 2013 count. Nobody yet measures how much parking new apartment buildings provide and use. The city's last downtown parking study, in 2013, reported the Regional Council's own 2010 data on all of downtown's 38,092 spaces together: on an average day, 54.8% were full. We found no count of apartment garages on their own. The figures come from RWC Consulting's assessment for the city, which cites the Council's 2010 survey of five downtown zones (250 lots); the year and zones differ from the 2022 count, so its 38,092 isn't directly comparable with the 43,787.
Core sources read 18 to 20 October 2026; the car-ownership and cost sources were read between 25 August and 7 October. County aerial permission dates to 22 October. The Council recap, permit portal fields and legal exceptions were checked on 28 October; Census margins were recomputed from the saved 2023 release that day.
wa_m_4712231_ne_10_060_20231007_20240209 and the rest of the 2023 Bellevue coverage, via Microsoft Planetary Computer, public domain.Updates and corrections.
Updated 4 Nov 2026. Added the Council’s 20 October direction from its draft minutes: a quarter-mile bus rapid transit exemption, dropping the visitor-parking minimum, and a 7-0 vote to bring the ordinance back for final action.
This page has been corrected. What changed
This page takes in an earlier one, “A quarter of downtown Bellevue's renters own no car. Near light rail, the city can no longer make builders add parking for them”, which was corrected. What changed
One email when a new story is published, with any corrections. Nothing else.
Getting around
4 min read
Getting around
5 min read
Community
11 min read